BES PortalLogin / BES OS
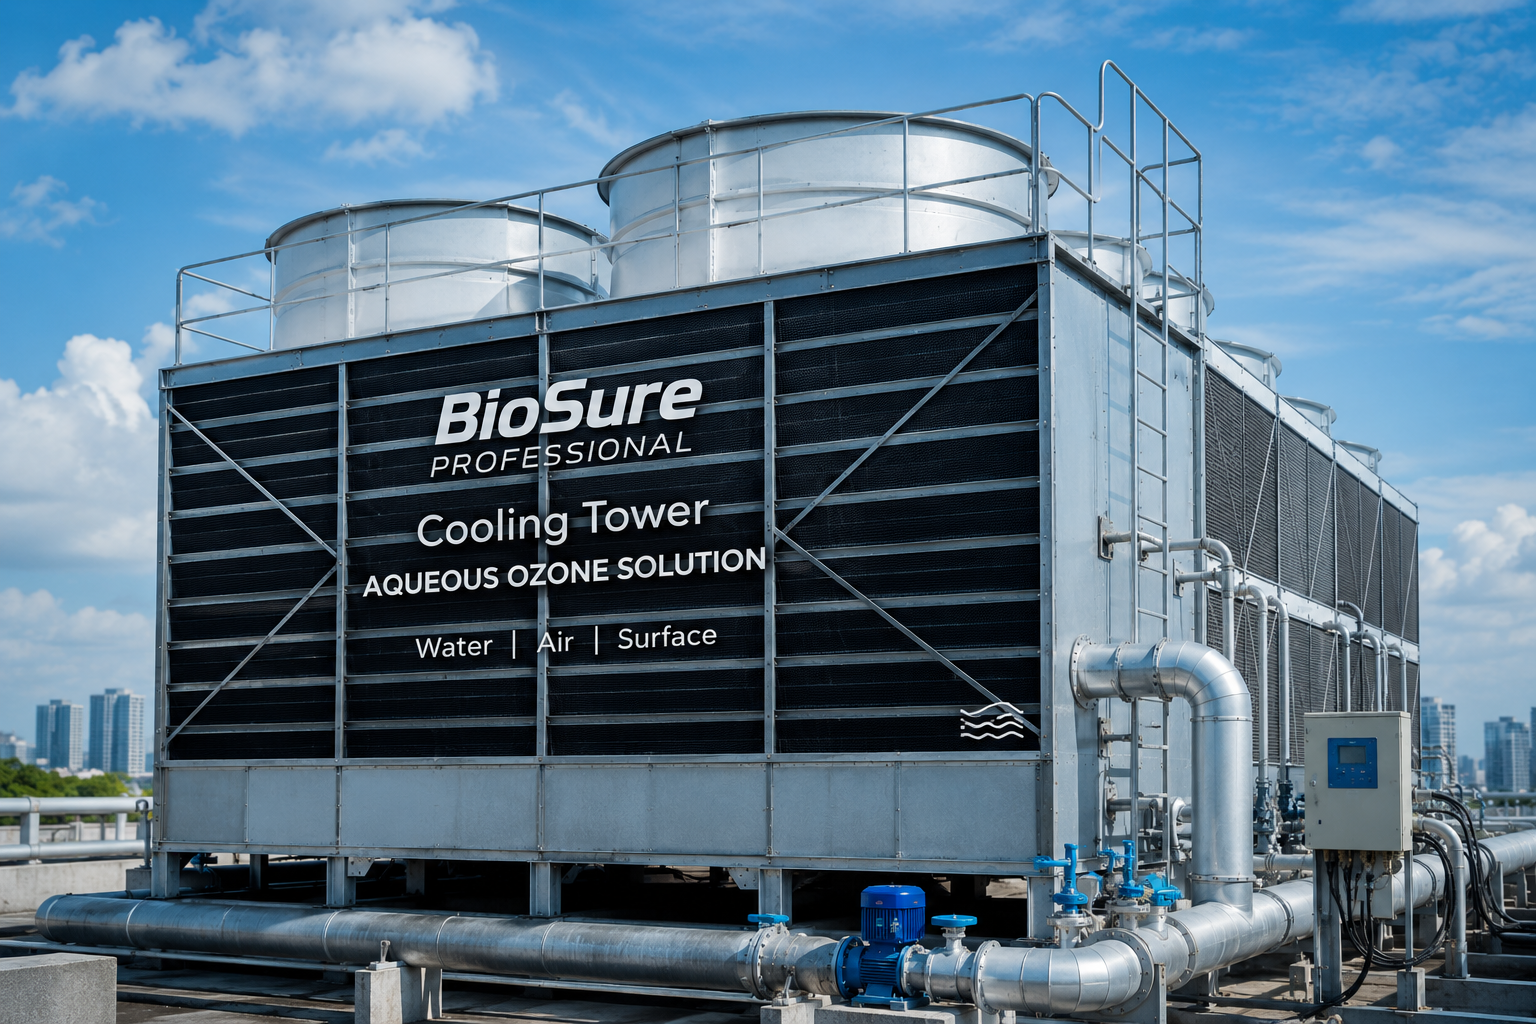
Cooling Tower
COOLING TOWER ECOSYSTEM

Cooling Tower Ozone Sidestream Simulation

Independent ozone sidestream engineering simulation for cooling tower treatment, covering staged hydraulics, ozone contact performance, Basin residual behavior, and operating cycles using BES Engineering Core v0.6.

ENGINEERING SIMULATION · NOT LIVE TELEMETRY

1. User Inputs

STEP 1Enter System DataEnter Cooling system context and the ozone treatment schedule.

4. Cooling Performance

STEP 4Review Cooling PerformanceReview the contact and hydraulic gate, Basin ozone response, and overall preliminary Cooling assessment.
CONTACT + HYDRAULIC DESIGN PASS means C-sub, Sidestream Contact CT (CT_sub) and Sidestream Hydraulic Turnover meet all three BES Preliminary Design Targets.This preliminary contact and hydraulic result does not verify whole-system ozone capacity, regulatory certification or microbial inactivation.3/3 DESIGN CRITERIA METPassing this gate confirms the listed contact and hydraulic design criteria only. It does not establish Cooling Tower equipment suitability.
KPI #1 · C-sub / Contact Inlet COzone concentration entering the Q-sub Contact Zone.The BES preliminary target checks contact-inlet concentration.Current applied equipment, Units, MTE and Q-sub influence this value. It does not verify whole-system ozone capacity.CURRENT VALUE0.50mg/L
BES Preliminary Design Target≥ 0.50 mg/L
STATUSPASS
VIEW CALCULATION
Transferred O₃ ÷ Q-sub600 mg/h ÷ 1,200 L/h= 0.50 mg/LBasis · Current applied capacity and Q-sub · Engineering Core result
KPI #2 · Sidestream Contact CT · CT_subContact-zone exposure after the modeled contact decay.The BES preliminary target uses Contact Outlet C × T10, never C-sub × nominal time or the operating cycle.Current applied Q-sub, Contact Zone Volume, contact decay and T10 basis influence it. This is WHO-informed engineering guidance, not a regulatory requirement.CURRENT VALUE1.00mg·min/L
BES Preliminary Design Target≥ 1.00 mg·min/L
STATUSPASS
VIEW CALCULATION
CT_sub = Contact Outlet C × T100.50 mg/L × 2.00 min= 1.00 mg·min/LBasis · Canonical Core Sidestream Contact CT · not C-sub × nominal time
KPI #3 · Sidestream Hydraulic TurnoverHow many Basin-volume equivalents circulate through the independent ozone sidestream hydraulically each day.The BES preliminary target checks daily hydraulic coverage.Current applied Q-side and Basin Volume influence it; ozone duty does not. This is hydraulic coverage only and does not prove ozone mass capacity or microbial inactivation.CURRENT VALUE2.00volumes/day
BES Preliminary Design Target≥ 2.00 volumes/day
STATUSPASS
VIEW CALCULATION
Q-side × Sidestream Hydraulic Runtime ÷ Basin Volume3,333.33 L/h × 24.00 h/day ÷ 40,000 L= 2.00 volumes/dayBasis · Hydraulic Runtime = 24 h/day continuous · independent from ozone duty
COOLING SYSTEM RESPONSE

Current Applied Engineering Design · Open-System C_basin(t)

BES BASIN DESIGN STANDARD + ENGINEERING REVIEW
KPI #4

AVERAGE BASIN OZONE CONCENTRATION

BES ENGINEERING DESIGN EVALUATION
CURRENT AVERAGE BASIN O₃0.02mg/LCalculated: 0.02262 mg/L
BES ENGINEERING DESIGN STANDARD0.025mg/LNot a WHO, legal, or regulatory limit
DESIGN STANDARD ACHIEVEMENT90.5%BELOW BES DESIGN STANDARDEngineering design evaluation only — not a regulatory compliance limit.
LIVE CALCULATIONEvaluation Window = final 24-hour representative periodCT_basin,24h = ∫ C_basin(t)dt over 1440 min= 32.5791 mg·min/LC_basin,avg = CT_basin,24h ÷ 1440 min32.5791 ÷ 1440= 0.02262 mg/LDisplayed KPI ≈ 0.02 mg/L
Achievement = C_basin,avg ÷ 0.025 × 1000.02262 ÷ 0.025 × 100= 90.5% · BELOW BES DESIGN STANDARD
Minimum Basin O₃Predicted ozone residual concentration in the Cooling Tower Basin.Generated by the canonical transient Basin mass balance. KPI #4 compares the final-24h average with the BES Engineering Design Standard; it is not a regulatory limit.0.020 mg/L
Maximum Basin O₃Predicted ozone residual concentration in the Cooling Tower Basin.Generated by the canonical transient Basin mass balance. KPI #4 compares the final-24h average with the BES Engineering Design Standard; it is not a regulatory limit.0.025 mg/L
Final Basin O₃Predicted ozone residual concentration in the Cooling Tower Basin.Generated by the canonical transient Basin mass balance. KPI #4 compares the final-24h average with the BES Engineering Design Standard; it is not a regulatory limit.0.020 mg/L
VIEW CALCULATION

C_basin(t) = M_O3(t) ÷ V(t) · TRAPEZOIDAL integration · timestep 3 min · 960 intervals.

Water: Makeup 0 L/h · Evaporation 0 L/h · Blowdown 0 L/h · Drift 0 L/h.

Ozone losses: decay, blowdown and drift modeled; stripping and demand follow their explicitly selected basis below.

Stabilization status: NOT VERIFIED — NO APPROVED STABILIZATION CRITERION

KPI #5

BASIN CT / OZONE EXPOSURE

CT_basin = ∫ C_basin(t)dt

ENGINEERING RESULT

Basin CT — separate from Sidestream Contact CT · CT_sub = 1.000 mg·min/L

PER COMPLETE OPERATING CYCLE2.04mg·min/L / cycle60 min ON + 30 min OFF = 90 min
PER 24 HOURS32.58mg·min/L / dayEvaluation: 0–24 h = 1440 min
LIVE CALCULATION · BASIN CTComplete Cycle = 60 min ON + 30 min OFF = 90 minEvaluation Window = final complete operating cycleCT_basin,ON = ∫ C_basin(t)dt over final ON segment= 1.3630 mg·min/LCT_basin,OFF = ∫ C_basin(t)dt over final OFF segment= 0.6732 mg·min/LCT_basin,cycle = CT_basin,ON + CT_basin,OFF1.3630 + 0.6732= 2.0362 mg·min/L / cycleC_basin,cycle,avg = CT_basin,cycle ÷ 90 min= 0.02262 mg/LKPI #4 uses a 24-hour evaluation window. KPI #5 cycle average uses the final complete operating cycle. The values are related but are not required to be identical.
CT_basin,24h = ∫0→1440 C_basin(t)dt= 32.5791 mg·min/L/daySecondary cross-check only:2.0362 × 16 complete cycles/day ≈ 32.5792 mg·min/LActual 24h integral difference = -0.0001 mg·min/L due to transient/non-identical cycle behavior.
Complete CycleOzone ON + Ozone OFF duration.The exposure integral uses the actual final complete C_basin(t) cycle.60 min ON + 30 min OFF = 90 min
Complete Cycles / DayNumber of complete operating cycles inside the current ozone operating window.Partial trailing cycles are not counted as complete.16
Ozone ON TimeOzone ON duration within each treatment cycle.This controls the ozone sidestream only and is independent from T10 and main circulation.16.00 h/day
Ozone OFF TimeOzone OFF duration within each treatment cycle.The ozone sidestream source is OFF; Basin residual may keep decaying while main circulation remains independent.8.00 h/day
24h Basin CTTrapezoidal integral of the same C_basin(t) used by KPI #4.Basin CT is a different evaluation zone from Sidestream Contact CT.32.579 mg·min/L/day
VIEW CALCULATION

BASIN CT / OZONE EXPOSURE = trapezoidal ∫ C_basin(t)dt from the same open-system series used by KPI #4.

Cycle window: 90 min final complete operating cycle · 24h window: 1440 min · timestep: 3 min.

Sidestream Contact CT (CT_sub) remains a separate contact-zone KPI and its ≥1.00 mg·min/L target is never applied to Basin CT.

MICROBIAL PERFORMANCE · REFERENCE ASSESSMENT

Estimated Basin CT Reference Accumulation

Published organism CT values are compared with the actual cumulative modeled Basin CT. The estimated time is a numerical reference comparison, not a validated inactivation prediction.

Current Operating Mode60 min ON / 30 min OFF
Comparison BasisMODELED BASIN CT · ACTUAL 24-H SERIES
Modeled Basin CT2.0362 mg·min/L
Sidestream Contact CT · CT_sub1.000 mg·min/L · separate zone
24h Basin CT32.5791 mg·min/L/day

COMPARISON BASIS: MODELED BASIN CT. CT_basin = ∫ C_basin(t)dt from the same actual 24-h series used by KPI #5 — not Sidestream Contact CT. No temperature interpolation/correction is applied. Numerical CT comparison does not establish regulatory compliance, guaranteed disinfection, or confirmed organism inactivation.

ORGANISM
E. coli
Reference Ozone CT
0.02 mg·min/L
Reference Outcome
99% inactivation · 2-log
Reference Conditions
5°C · pH 6–7
MODELED BASIN CT / COMPLETE CYCLE
2.0362 mg·min/L
ESTIMATED TIME TO REFERENCE CT1.0 minTotal elapsed: 1.00 minEquivalent: 0.02 hrEstimated time for modeled Basin CT to accumulate to the published reference CT value.

NUMERICAL REFERENCE COMPARISON ONLY

REFERENCE CT ACCUMULATED WITHIN MODELED CYCLE

CYCLE POSITIONCycle 1 · 1.0 min into cycleCurrent cycle: 60 min ON + 30 min OFF = 90 minReached during: ON period
VIEW BASIS

Organism: E. coli

Reference CT: 0.02 mg·min/L

Reference outcome: 99% inactivation · 2-log

Temperature / pH: 5°C · pH 6–7

Source organization: World Health Organization

Source document: Water Treatment and Pathogen Control · Table 3.7

Reference type: WHO LITERATURE GUIDELINE REFERENCE

Limitations: Applies to the cited water-treatment conditions and suspended organisms; it is not a swimming-pool regulatory standard.

VIEW LIVE CALCULATION

A. Reference CT: 0.02 mg·min/L

B. Modeled concentration source: C_basin(t) from the current open-system Basin simulation — the same equations and state trajectory used by KPI #5.

C. Cumulative Basin exposure: CT_basin(t) = ∫ C_basin(τ)dτ

D. Initial 24-hour result: CT_basin,24h = 32.5791 mg·min/L

E. Continued integration: Preserve the hour-24 state and continue the current ON/OFF model for up to 168 h.

F. Threshold search: Find the first integrated point where CT_basin(t) ≥ CT_reference, resolving the crossing inside the trapezoidal timestep.

Reference CT: 0.020 mg·min/L

Cumulative Basin CT search: first time CT_basin(t) ≥ CT_reference

Initial 24-hour Basin CT: 32.5791 mg·min/L

Total elapsed: 0.9963 min

Equivalent: 0.02 hr

Converted time: 1.0 min

Cycle length: 60 min ON + 30 min OFF = 90 min

Complete cycles elapsed: floor(0.9963 ÷ 90) = 0

Time into current cycle: 0.9963 mod 90 = 1.00 min

Cycle position: Cycle 1 · 1.00 min into cycle

Reached during: ON period

Average-C approximation only: CT_reference ÷ C_basin,24h,avg ≈ 0.88 min

Actual method: first cumulative trapezoidal CT_basin(t) crossing

MODELED BASIN CT / COMPLETE CYCLE: 2.0362 mg·min/L

Secondary Numerical CT Ratio: 2.0362 ÷ 0.020 = 101.81×

This ratio compares numerical CT magnitude only.

Reference temperature: 5°C

Current water temperature: 30.0°C

Current water pH: 7.50

Temperature correction: NOT APPLIED

Interpretation: Estimated time is a numerical Basin CT accumulation comparison only and is not a validated microbial inactivation prediction under current site conditions.

Source / reference basis: World Health Organization · Water Treatment and Pathogen Control · Table 3.7

ORGANISM
Poliovirus 1
Reference Ozone CT
0.10–0.20 mg·min/L
Reference Outcome
99% inactivation · 2-log
Reference Conditions
5°C · pH 6–7
MODELED BASIN CT / COMPLETE CYCLE
2.0362 mg·min/L
ESTIMATED TIME TO REFERENCE CT4.9–9.7 minTotal elapsed: 4.93–9.75 minEquivalent: 0.08 hr–0.16 hrEstimated time for modeled Basin CT to accumulate to the published reference CT value.

NUMERICAL REFERENCE COMPARISON ONLY

REFERENCE CT ACCUMULATED WITHIN MODELED CYCLE

CYCLE POSITIONLower reference: Cycle 1 · 4.9 min into cycleUpper reference: Cycle 1 · 9.7 min into cycleCurrent cycle: 60 min ON + 30 min OFF = 90 minReached during: lower ON / upper ON
VIEW BASIS

Organism: Poliovirus 1

Reference CT: 0.10–0.20 mg·min/L

Reference outcome: 99% inactivation · 2-log

Temperature / pH: 5°C · pH 6–7

Source organization: World Health Organization

Source document: Water Treatment and Pathogen Control · Table 3.7

Reference type: WHO LITERATURE GUIDELINE REFERENCE

Limitations: Applies to the cited water-treatment conditions and suspended organisms; it is not a swimming-pool regulatory standard.

VIEW LIVE CALCULATION

A. Reference CT: 0.10–0.20 mg·min/L

B. Modeled concentration source: C_basin(t) from the current open-system Basin simulation — the same equations and state trajectory used by KPI #5.

C. Cumulative Basin exposure: CT_basin(t) = ∫ C_basin(τ)dτ

D. Initial 24-hour result: CT_basin,24h = 32.5791 mg·min/L

E. Continued integration: Preserve the hour-24 state and continue the current ON/OFF model for up to 168 h.

F. Threshold search: Find the first integrated point where CT_basin(t) ≥ CT_reference, resolving the crossing inside the trapezoidal timestep.

Lower reference CT: 0.100 mg·min/L

Cumulative Basin CT search: first time CT_basin(t) ≥ CT_reference

Initial 24-hour Basin CT: 32.5791 mg·min/L

Total elapsed: 4.9320 min

Equivalent: 0.08 hr

Converted time: 4.9 min

Cycle length: 60 min ON + 30 min OFF = 90 min

Complete cycles elapsed: floor(4.9320 ÷ 90) = 0

Time into current cycle: 4.9320 mod 90 = 4.93 min

Cycle position: Cycle 1 · 4.93 min into cycle

Reached during: ON period

Average-C approximation only: CT_reference ÷ C_basin,24h,avg ≈ 4.42 min

Actual method: first cumulative trapezoidal CT_basin(t) crossing

Upper reference CT: 0.200 mg·min/L

Cumulative Basin CT search: first time CT_basin(t) ≥ CT_reference

Initial 24-hour Basin CT: 32.5791 mg·min/L

Total elapsed: 9.7483 min

Equivalent: 0.16 hr

Converted time: 9.7 min

Cycle length: 60 min ON + 30 min OFF = 90 min

Complete cycles elapsed: floor(9.7483 ÷ 90) = 0

Time into current cycle: 9.7483 mod 90 = 9.75 min

Cycle position: Cycle 1 · 9.75 min into cycle

Reached during: ON period

Average-C approximation only: CT_reference ÷ C_basin,24h,avg ≈ 8.84 min

Actual method: first cumulative trapezoidal CT_basin(t) crossing

MODELED BASIN CT / COMPLETE CYCLE: 2.0362 mg·min/L

Secondary Numerical CT Ratio: 2.0362 ÷ 0.200 = 10.18× to 2.0362 ÷ 0.100 = 20.36×

This ratio compares numerical CT magnitude only.

Reference temperature: 5°C

Current water temperature: 30.0°C

Current water pH: 7.50

Temperature correction: NOT APPLIED

Interpretation: Estimated time is a numerical Basin CT accumulation comparison only and is not a validated microbial inactivation prediction under current site conditions.

Source / reference basis: World Health Organization · Water Treatment and Pathogen Control · Table 3.7

ORGANISM
Giardia lamblia
Reference Ozone CT
0.63 mg·min/L
Reference Outcome
99% inactivation · 2-log
Reference Conditions
15°C · pH 6–9
MODELED BASIN CT / COMPLETE CYCLE
2.0362 mg·min/L
ESTIMATED TIME TO REFERENCE CT29.4 minTotal elapsed: 29.38 minEquivalent: 0.49 hrEstimated time for modeled Basin CT to accumulate to the published reference CT value.

NUMERICAL REFERENCE COMPARISON ONLY

REFERENCE CT ACCUMULATED WITHIN MODELED CYCLE

CYCLE POSITIONCycle 1 · 29.4 min into cycleCurrent cycle: 60 min ON + 30 min OFF = 90 minReached during: ON period
VIEW BASIS

Organism: Giardia lamblia

Reference CT: 0.63 mg·min/L

Reference outcome: 99% inactivation · 2-log

Temperature / pH: 15°C · pH 6–9

Source organization: World Health Organization

Source document: Guidelines for Drinking-water Quality, Third Edition incorporating the First and Second Addenda · Table 7.6

Reference type: WHO LITERATURE GUIDELINE REFERENCE

Limitations: No automatic temperature interpolation is applied. The cited CT is condition-specific.

VIEW LIVE CALCULATION

A. Reference CT: 0.63 mg·min/L

B. Modeled concentration source: C_basin(t) from the current open-system Basin simulation — the same equations and state trajectory used by KPI #5.

C. Cumulative Basin exposure: CT_basin(t) = ∫ C_basin(τ)dτ

D. Initial 24-hour result: CT_basin,24h = 32.5791 mg·min/L

E. Continued integration: Preserve the hour-24 state and continue the current ON/OFF model for up to 168 h.

F. Threshold search: Find the first integrated point where CT_basin(t) ≥ CT_reference, resolving the crossing inside the trapezoidal timestep.

Reference CT: 0.630 mg·min/L

Cumulative Basin CT search: first time CT_basin(t) ≥ CT_reference

Initial 24-hour Basin CT: 32.5791 mg·min/L

Total elapsed: 29.3834 min

Equivalent: 0.49 hr

Converted time: 29.4 min

Cycle length: 60 min ON + 30 min OFF = 90 min

Complete cycles elapsed: floor(29.3834 ÷ 90) = 0

Time into current cycle: 29.3834 mod 90 = 29.38 min

Cycle position: Cycle 1 · 29.38 min into cycle

Reached during: ON period

Average-C approximation only: CT_reference ÷ C_basin,24h,avg ≈ 27.85 min

Actual method: first cumulative trapezoidal CT_basin(t) crossing

MODELED BASIN CT / COMPLETE CYCLE: 2.0362 mg·min/L

Secondary Numerical CT Ratio: 2.0362 ÷ 0.630 = 3.23×

This ratio compares numerical CT magnitude only.

Reference temperature: 15°C

Current water temperature: 30.0°C

Current water pH: 7.50

Temperature correction: NOT APPLIED

Interpretation: Estimated time is a numerical Basin CT accumulation comparison only and is not a validated microbial inactivation prediction under current site conditions.

Source / reference basis: World Health Organization · Guidelines for Drinking-water Quality, Third Edition incorporating the First and Second Addenda · Table 7.6

ORGANISM
Cryptosporidium
Reference Ozone CT
4.40 mg·min/L
Reference Outcome
99% inactivation · 2-log
Reference Conditions
22°C · pH not stated
MODELED BASIN CT / COMPLETE CYCLE
2.0362 mg·min/L
ESTIMATED TIME TO REFERENCE CT3 hr 16 minTotal elapsed: 195.75 minEquivalent: 3.26 hrEstimated time for modeled Basin CT to accumulate to the published reference CT value.

NUMERICAL REFERENCE COMPARISON ONLY

REFERENCE CT ACCUMULATED ACROSS MODELED CYCLES

CYCLE POSITIONCycle 3 · 15.7 min into cycleOperating-cycle equivalent: 2 complete cycles + 15.7 minCurrent cycle: 60 min ON + 30 min OFF = 90 minReached during: ON period
VIEW BASIS

Organism: Cryptosporidium

Reference CT: 4.40 mg·min/L

Reference outcome: 99% inactivation · 2-log

Temperature / pH: 22°C · pH not stated

Source organization: World Health Organization

Source document: Water Treatment and Pathogen Control · Table 3.9

Reference type: WHO LITERATURE REFERENCE

Limitations: Not a universal ozone CT standard. Published CT values vary with temperature, study method and analytical endpoint.

VIEW LIVE CALCULATION

A. Reference CT: 4.40 mg·min/L

B. Modeled concentration source: C_basin(t) from the current open-system Basin simulation — the same equations and state trajectory used by KPI #5.

C. Cumulative Basin exposure: CT_basin(t) = ∫ C_basin(τ)dτ

D. Initial 24-hour result: CT_basin,24h = 32.5791 mg·min/L

E. Continued integration: Preserve the hour-24 state and continue the current ON/OFF model for up to 168 h.

F. Threshold search: Find the first integrated point where CT_basin(t) ≥ CT_reference, resolving the crossing inside the trapezoidal timestep.

Reference CT: 4.400 mg·min/L

Cumulative Basin CT search: first time CT_basin(t) ≥ CT_reference

Initial 24-hour Basin CT: 32.5791 mg·min/L

Total elapsed: 195.7457 min

Equivalent: 3.26 hr

Converted time: 3 hr 16 min

Cycle length: 60 min ON + 30 min OFF = 90 min

Complete cycles elapsed: floor(195.7457 ÷ 90) = 2

Time into current cycle: 195.7457 mod 90 = 15.75 min

Cycle position: Cycle 3 · 15.75 min into cycle

Reached during: ON period

Average-C approximation only: CT_reference ÷ C_basin,24h,avg ≈ 194.48 min

Actual method: first cumulative trapezoidal CT_basin(t) crossing

MODELED BASIN CT / COMPLETE CYCLE: 2.0362 mg·min/L

Secondary Numerical CT Ratio: 2.0362 ÷ 4.400 = 0.46×

This ratio compares numerical CT magnitude only.

Reference temperature: 22°C

Current water temperature: 30.0°C

Current water pH: 7.50

Temperature correction: NOT APPLIED

Interpretation: Estimated time is a numerical Basin CT accumulation comparison only and is not a validated microbial inactivation prediction under current site conditions.

Source / reference basis: World Health Organization · Water Treatment and Pathogen Control · Table 3.9

ORGANISM
Legionella pneumophila
Reference Ozone CT
6.00 mg·min/L
Reference Outcome
approximately 99.99–99.999% inactivation · 4–5 log
Reference Conditions
Temperature not stated · pH not stated
MODELED BASIN CT / COMPLETE CYCLE
2.0362 mg·min/L
ESTIMATED TIME TO REFERENCE CT4 hr 25 minTotal elapsed: 264.69 minEquivalent: 4.41 hrEstimated time for modeled Basin CT to accumulate to the published reference CT value.

NUMERICAL REFERENCE COMPARISON ONLY

REFERENCE CT ACCUMULATED ACROSS MODELED CYCLES

CYCLE POSITIONCycle 3 · 84.7 min into cycleOperating-cycle equivalent: 2 complete cycles + 84.7 minCurrent cycle: 60 min ON + 30 min OFF = 90 minReached during: OFF period
VIEW BASIS

Organism: Legionella pneumophila

Reference CT: 6.00 mg·min/L

Reference outcome: approximately 99.99–99.999% inactivation · 4–5 log

Temperature / pH: Temperature not stated · pH not stated

Source organization: World Health Organization

Source document: Guidelines for Drinking-water Quality, Second Edition, Volume 2: Health Criteria and Other Supporting Information · Legionella chapter · Ozone discussion

Reference type: DERIVED LITERATURE EXPOSURE

Limitations: WHO reports that ozone eradication results in real water systems remain ambiguous and that adequate residual/contact time may be difficult to maintain.

VIEW LIVE CALCULATION

A. Reference CT: 6.00 mg·min/L

B. Modeled concentration source: C_basin(t) from the current open-system Basin simulation — the same equations and state trajectory used by KPI #5.

C. Cumulative Basin exposure: CT_basin(t) = ∫ C_basin(τ)dτ

D. Initial 24-hour result: CT_basin,24h = 32.5791 mg·min/L

E. Continued integration: Preserve the hour-24 state and continue the current ON/OFF model for up to 168 h.

F. Threshold search: Find the first integrated point where CT_basin(t) ≥ CT_reference, resolving the crossing inside the trapezoidal timestep.

Reference CT: 6.000 mg·min/L

Cumulative Basin CT search: first time CT_basin(t) ≥ CT_reference

Initial 24-hour Basin CT: 32.5791 mg·min/L

Total elapsed: 264.6861 min

Equivalent: 4.41 hr

Converted time: 4 hr 25 min

Cycle length: 60 min ON + 30 min OFF = 90 min

Complete cycles elapsed: floor(264.6861 ÷ 90) = 2

Time into current cycle: 264.6861 mod 90 = 84.69 min

Cycle position: Cycle 3 · 84.69 min into cycle

Reached during: OFF period

Average-C approximation only: CT_reference ÷ C_basin,24h,avg ≈ 265.20 min

Actual method: first cumulative trapezoidal CT_basin(t) crossing

MODELED BASIN CT / COMPLETE CYCLE: 2.0362 mg·min/L

Secondary Numerical CT Ratio: 2.0362 ÷ 6.000 = 0.34×

This ratio compares numerical CT magnitude only.

Reference temperature: Not stated

Current water temperature: 30.0°C

Current water pH: 7.50

Temperature correction: NOT APPLIED

Interpretation: Estimated time is a numerical Basin CT accumulation comparison only and is not a validated microbial inactivation prediction under current site conditions.

Source / reference basis: World Health Organization · Guidelines for Drinking-water Quality, Second Edition, Volume 2: Health Criteria and Other Supporting Information · Legionella chapter · Ozone discussion

OVERALL COOLING ASSESSMENT

ENGINEERING REVIEW

WHOLE-SYSTEM ACCEPTANCE NOT YET APPROVED
Contact + Hydraulic3/3 criteria met
Basin Ozone LevelBELOW BES DESIGN STANDARD
Basin CT / ExposureEngineering Result
Microbial ReferenceNumerical CT Comparison
OverallEngineering Review

Cooling-specific whole-system acceptance criteria have not yet been approved.

SUPPORTING ENGINEERING RESULTS · Water Balance + Ozone Loss Basis
Overall Engineering Review Items
  • Cooling whole-system sizing basis is not approved.
  • Equipment quantity is not sized.
  • Cooling-specific whole-system acceptance target is not approved.
  • Basin decay uses a provisional BES estimate.
  • No approved Cooling System ozone acceptance target exists.
  • Cooling equipment quantity remains not yet sized.
  • Evaporation changes water inventory but is not treated as a dissolved-ozone liquid loss.
  • AIR STRIPPING NOT YET MODELED.
  • CHEMICAL / BIOLOGICAL OZONE DEMAND NOT CONFIGURED.

Cooling RT remains CONTEXT / OPTIONAL WATER-BALANCE BASIS and is not used to derive evaporation or ozone demand. All zero values below are visible operator inputs; no coefficient is hidden.

Makeup FlowWater entering the Cooling System inventory.Derived live as Q_evap + Q_blowdown + Q_drift + Q_other_loss; makeup ozone concentration = 0 mg/L.0 L/h · DERIVED AUTO LEVEL BALANCE
VIEW BASIS · Ozone Loss Assumptions
Model StatusOpen-system calculation status.It remains Engineering Review because no whole-system acceptance target exists.MODELED WITH ENGINEERING REVIEW
Bulk DecayProvisional BES Decay Estimate from temperature, pH and TDS; not verified and not regulatory.Temperature 30 °C · pH 7.5 · TDS 300 mg/L0.44 1/h · PROVISIONAL
Air StrippingSeparate gas-transfer loss term.Never inferred from evaporation.NOT CONFIGURED
Ozone DemandSeparate chemical / biological ozone demand term.No default coefficient is invented.NOT CONFIGURED
Other Configured Ozone LossReserved for a separately configured and proven loss term.No hidden other-loss coefficient is applied.NOT CONFIGURED
Open-System Response + Mass Balance Closure

Water: dV/dt = Q_makeup − Q_evap − Q_blowdown − Q_drift − Q_other_loss

Ozone: dM/dt = Ṁ_after-contact − decay − blowdown − drift − stripping − demand

WATER BALANCE SUMMARY

MakeupQ_makeup = Q_evap + Q_blowdown + Q_drift + Q_other_lossMakeup O₃ concentration = 0 mg/L unless configured in a future approved extension.0 L/h
EvaporationWater-only loss in this dissolved-ozone model.It changes V(t) and is not multiplied by liquid ozone concentration.0 L/h
BlowdownManual engineering inputLiquid water and dissolved-ozone loss.0 L/h
DriftLiquid droplet loss.Kept distinct from evaporation and stripping.0 L/h
Net Volume ChangeFinal volume minus initial volume over the evaluation window.Expected near zero in constant-level mode.0.000e+0 L/day
Volume Balance ClosureWater input − water losses − stored-water change.Numerical conservation reference, not a Cooling acceptance KPI.0.000e+0 L/day

OZONE LOSS BREAKDOWN

Daily O₃ InputMass after Contact integrated over ozone ON intervals.Single bulk-control-volume ozone source.9,600.00 mg/day
Decay Lossk_decay × M_O3.Provisional bulk decay basis. 9,599.98 mg/day
Blowdown LossQ_blowdown × C_system.Real liquid ozone mass removal.0.00 mg/day
Drift LossQ_drift × C_system.Separate from evaporation.0.00 mg/day
Stripping Lossk_stripping × M_O3 only when explicitly enabled.AIR STRIPPING NOT YET MODELED.NOT CONFIGURED
Demand LossConfigured first-order or mass-rate demand.DEMAND NOT CONFIGURED.NOT CONFIGURED
Other Configured LossNo additional ozone loss term is configured.No hidden zero-valued loss is presented as modeled.NOT CONFIGURED
Water Closure ErrorWater input − water losses − stored-water change.Numerical conservation audit.0.000e+0 L/day
Ozone Closure ErrorO₃ input − categorized losses − stored-mass change.Numerical conservation audit.-3.411e-13 mg/day

No approved Cooling System ozone acceptance target exists.

Cooling equipment quantity remains not yet sized.

Evaporation changes water inventory but is not treated as a dissolved-ozone liquid loss.

AIR STRIPPING NOT YET MODELED.

CHEMICAL / BIOLOGICAL OZONE DEMAND NOT CONFIGURED.

SUPPORTING ENGINEERING RESULTS · Capacity + Contact Diagnostics
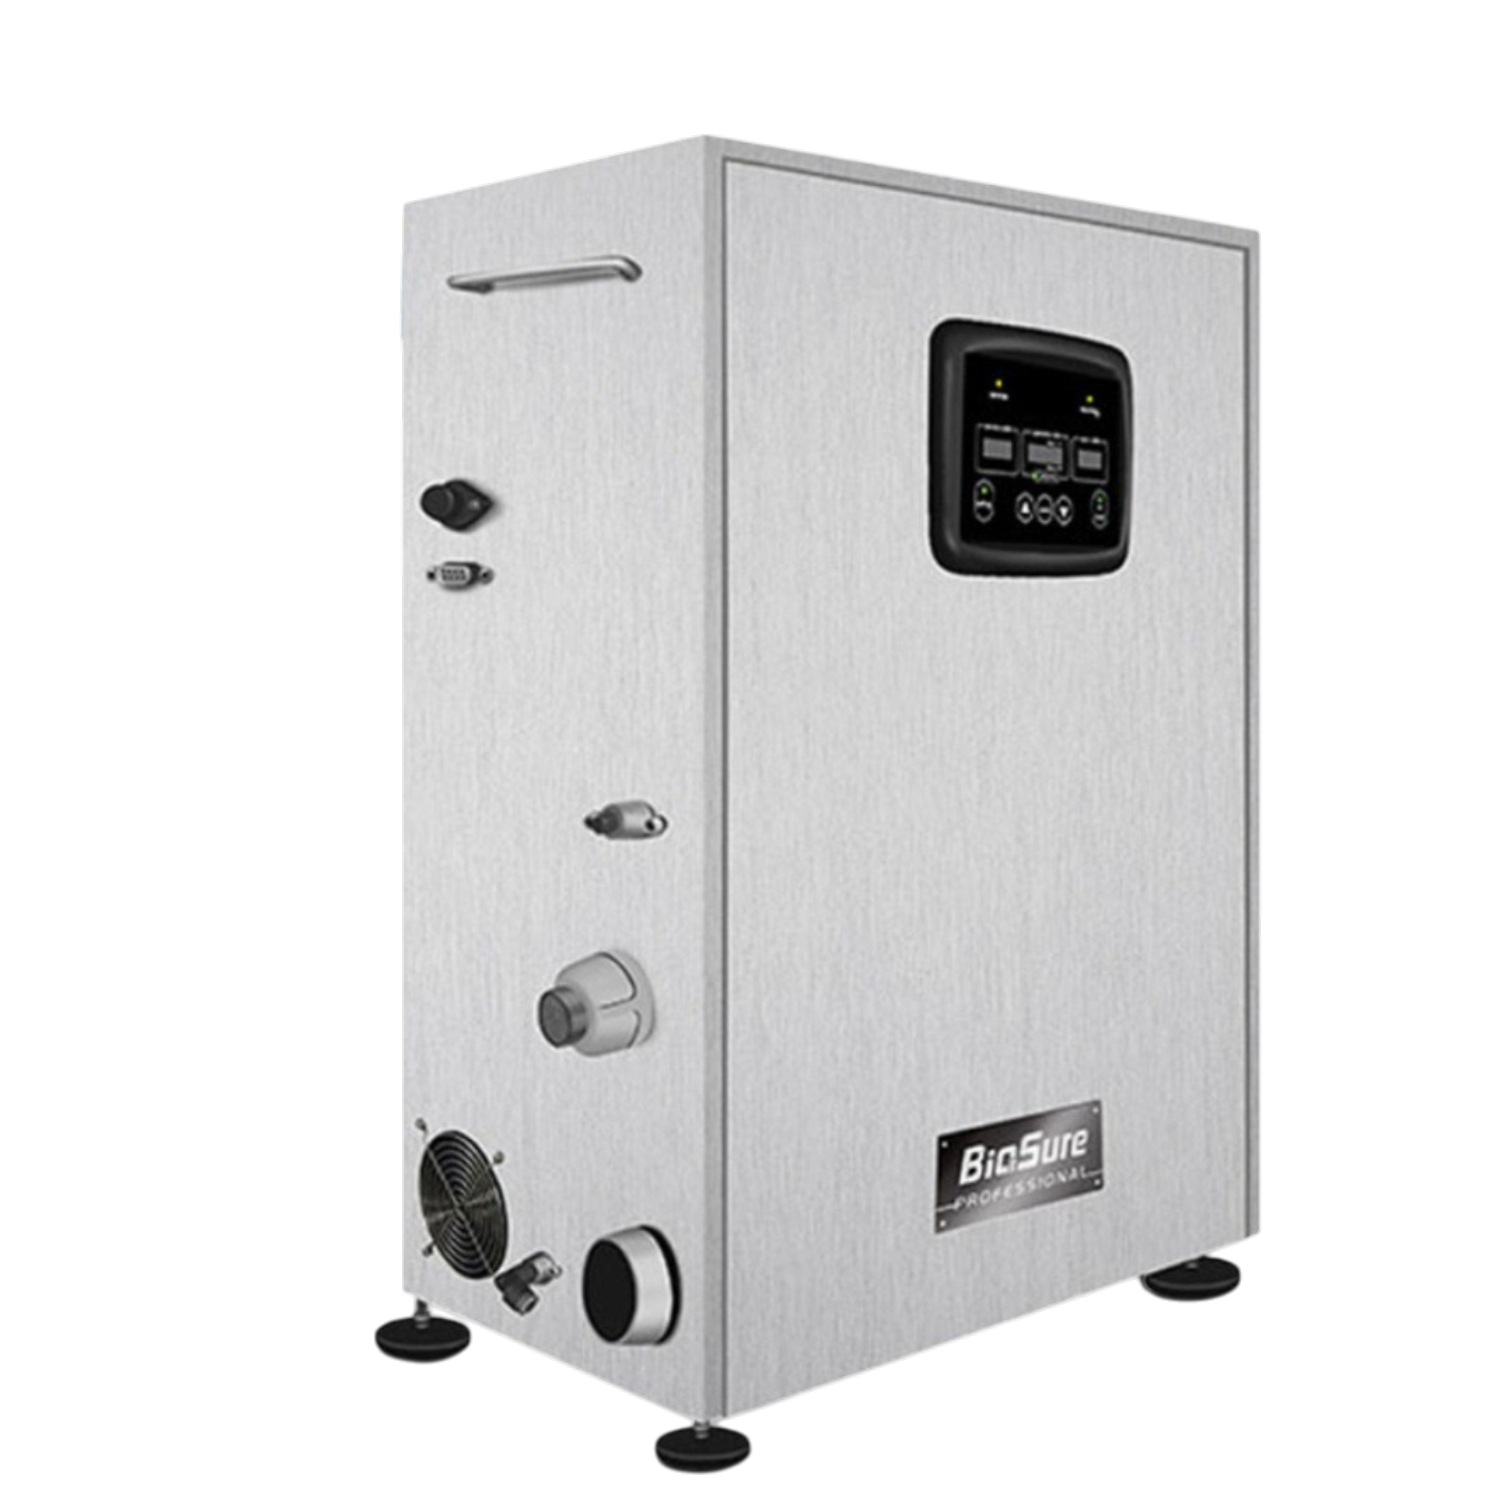
Applied EquipmentOperator-entered quantity for the current ozone-generator configuration.Cooling equipment quantity is not sized in Phase 1 and remains subject to whole-system engineering verification.1 × OWS-1
Total Rated CapacityGross generation from current model and Units.No whole-system suitability claim is inferred.1,000 mg/h
Transferred CapacityMass Transfer Efficiency — ozone transferred into Q-sub water.Transferred O₃ = rated generation × MTE.600 mg/h
Daily Transferred O₃Transferred capacity × actual ozone ON hours/day.Raw capacity diagnostic; current KPI4/5 use mass after Contact.9.60 g/day
Daily Transferred O₃ DoseDaily transferred ozone mass ÷ Basin Volume.Supporting diagnostic; no approved target.0.24 mg/L/day
Sidestream Hydraulic Turnover TimeHow many Basin-volume equivalents circulate through the independent ozone sidestream hydraulically each day.The BES preliminary target checks daily hydraulic coverage.Current applied Q-side and Basin Volume influence it; ozone duty does not. This is hydraulic coverage only and does not prove ozone mass capacity or microbial inactivation.12.00 h
Sidestream Hydraulic RuntimeHow many Basin-volume equivalents circulate through the independent ozone sidestream hydraulically each day.The BES preliminary target checks daily hydraulic coverage.Current applied Q-side and Basin Volume influence it; ozone duty does not. This is hydraulic coverage only and does not prove ozone mass capacity or microbial inactivation.24.00 h/day continuous
Contact Outlet COzone concentration leaving the contact zone.Calculated after the modeled Q-sub contact process.0.50 mg/L
C-sideOzone concentration after Q-sub is diluted into Q-side.C-side is the sidestream concentration before Basin return.0.18 mg/L
Basin CPredicted ozone residual concentration in the Cooling Tower Basin.Generated by the canonical transient Basin mass balance. KPI #4 compares the final-24h average with the BES Engineering Design Standard; it is not a regulatory limit.0.02 mg/L
Main Circulation ContextMain Cooling Tower circulation flow.It is separate from the ozone treatment sidestream and is not controlled by the ozone ON/OFF schedule.240,000 L/h
Nominal Contact TimeHydraulic residence time through the Q-sub contact zone.Nominal Contact Time = Contact Zone Volume ÷ Q-sub flow.2.00 min
Estimated T10 — Design BasisPreliminary effective contact time used for CT estimation.Estimated T10 is a design basis, not a measured hydraulic T10.2.00 min · not measured
Legacy Core Basin CT / Latest CycleBasin CT integrated over one operating cycle.CT_basin includes both ozone ON and OFF residual periods and is separate from Sidestream Contact CT (CT_sub).2.04 mg·min/L · supporting diagnostic
Legacy Core Basin CT / Average CycleBasin CT integrated over one operating cycle.CT_basin includes both ozone ON and OFF residual periods and is separate from Sidestream Contact CT (CT_sub).1.95 mg·min/L · supporting diagnostic
View Calculation Basis

2-day internal horizon · Initial Basin C 0 mg/L · no additional contact-zone decay assumed · Estimated T10 is not measured · Basin decay is a Provisional BES Decay Estimate.
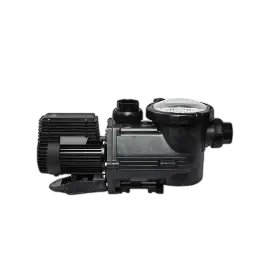
3. Current Applied Engineering Diagram

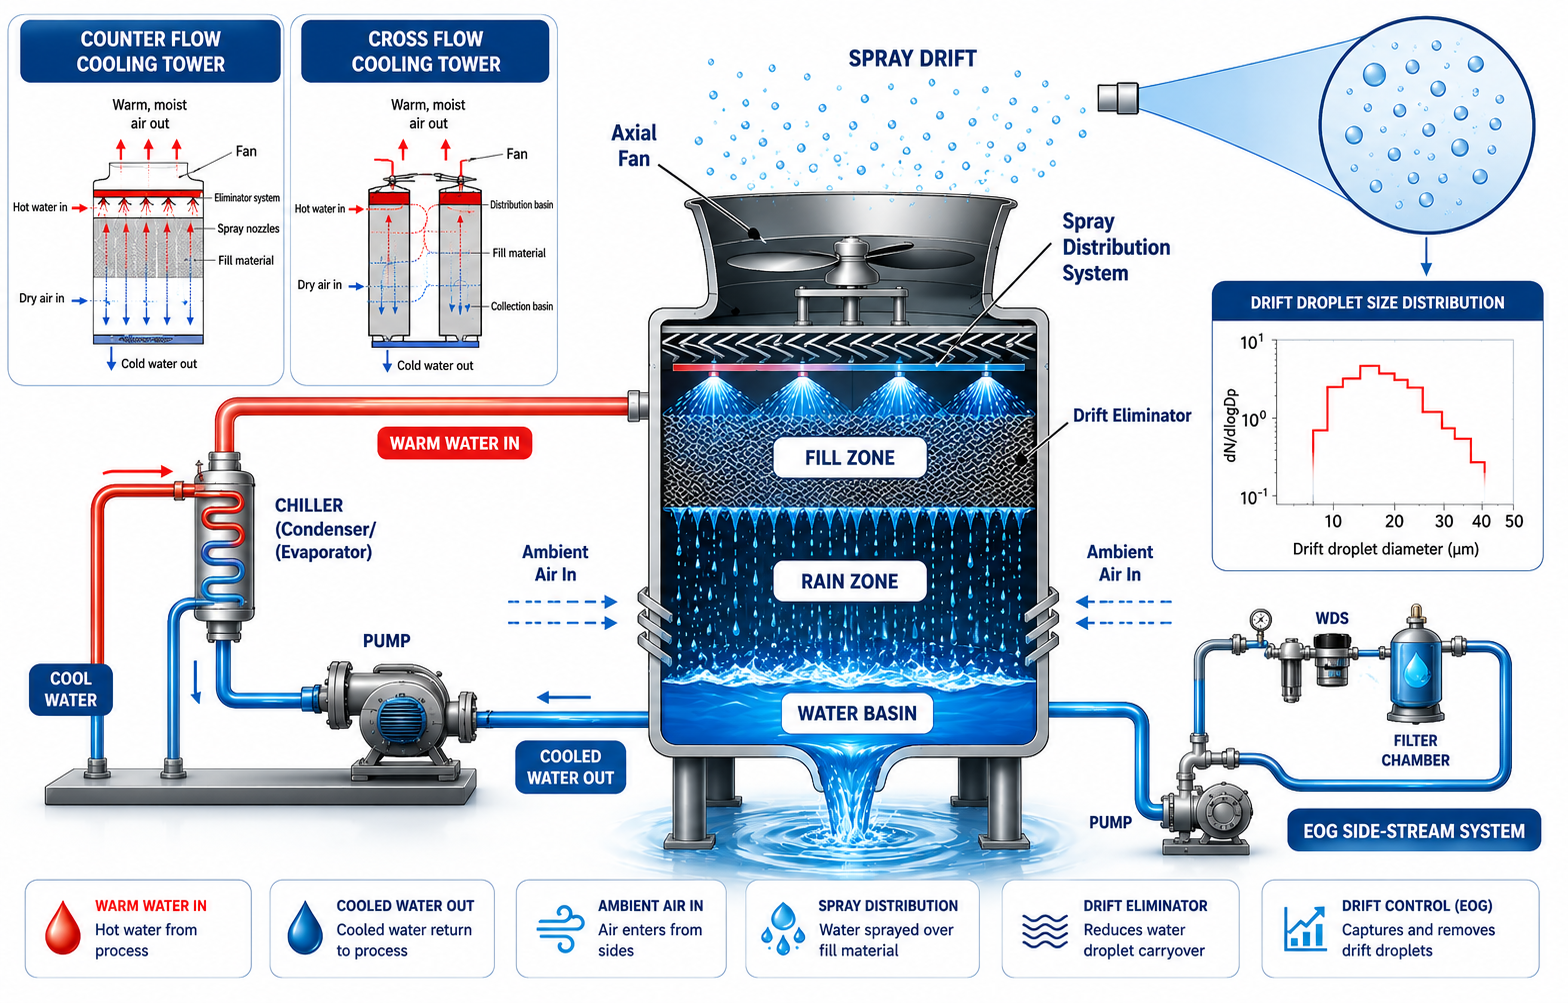
STEP 3Current Applied Engineering DiagramLive engineering diagram and applied hydraulic values used by every KPI.
ModelEquipment model selected by the user.The BES recommendation does not automatically change this model.OWS-1
MTEMass Transfer Efficiency — ozone transferred into Q-sub water.Transferred O₃ = rated generation × MTE.60%
C-subOzone concentration entering the Q-sub Contact Zone.The BES preliminary target checks contact-inlet concentration.Current applied equipment, Units, MTE and Q-sub influence this value. It does not verify whole-system ozone capacity.0.50 mg/L
Sidestream Contact CT · CT_subContact-zone exposure after the modeled contact decay.The BES preliminary target uses Contact Outlet C × T10, never C-sub × nominal time or the operating cycle.Current applied Q-sub, Contact Zone Volume, contact decay and T10 basis influence it. This is WHO-informed engineering guidance, not a regulatory requirement.1.00 mg·min/L
Hydraulic CoverageHow many Basin-volume equivalents circulate through the independent ozone sidestream hydraulically each day.The BES preliminary target checks daily hydraulic coverage.Current applied Q-side and Basin Volume influence it; ozone duty does not. This is hydraulic coverage only and does not prove ozone mass capacity or microbial inactivation.2.00 volumes/day
Cooling towerSidestream pumpOWS-1Filter and contact zone
OWS-11,000 mg/h total
Q-side · Ozone Treatment SidestreamWater flow through the independent ozone sidestream.Approved Q-side hydraulic runtime is continuous 24 h/day and remains independent from the ozone operating window.3,333.33 L/h
Q-sub · Ozone Contact Sub-flowSub-flow inside Q-side that receives transferred ozone.Q-sub passes through the Contact Zone and determines C-sub / Contact Inlet C.1,200 L/h
C-sub · Contact InletOzone concentration entering the Q-sub Contact Zone.The BES preliminary target checks contact-inlet concentration.Current applied equipment, Units, MTE and Q-sub influence this value. It does not verify whole-system ozone capacity.0.50 mg/L
Contact Outlet CContact-zone exposure after the modeled contact decay.The BES preliminary target uses Contact Outlet C × T10, never C-sub × nominal time or the operating cycle.Current applied Q-sub, Contact Zone Volume, contact decay and T10 basis influence it. This is WHO-informed engineering guidance, not a regulatory requirement.0.50 mg/L · T10 2.00 min
C-side · Sidestream ReturnOzone concentration after Q-sub is diluted into Q-side.C-side is the sidestream concentration before Basin return.0.18 mg/L
Basin CPredicted ozone residual concentration in the Cooling Tower Basin.Generated by the canonical transient Basin mass balance. KPI #4 compares the final-24h average with the BES Engineering Design Standard; it is not a regulatory limit.0.02 mg/L

Engineering Design Basis & Limitations

C-sub / Contact Inlet C

BES Preliminary Design Target ≥ 0.50 mg/L

Contact concentration target only. It does not verify whole-system ozone capacity.

Contact CT

BES Preliminary Design Target ≥ 1.00 mg·min/L

Contact Outlet C × T10. This is a BES preliminary contact-process design target, not a Pool exposure target or regulatory requirement. Any organism-specific comparison requires an approved, explicitly provenanced reference dataset and defined operating conditions.

Sidestream Hydraulic Turnover

BES Preliminary Design Target ≥ 2.00 volumes/day

Q-side × 24 h/day ÷ Basin Volume. The approved Q-side hydraulic runtime is continuous 24 h/day and remains independent from ozone generator duty.

Whole-System Ozone Capacity

Engineering capacity indicator · no approved acceptance target

Daily transferred ozone mass and normalized dose expose equipment scale. They remain separate from contact and hydraulic coverage PASS/FAIL.

PASS means the current applied design meets all three BES preliminary contact and hydraulic coverage targets. It does not by itself establish final whole-system ozone capacity, equipment suitability, regulatory certification or third-party microbial validation. Final performance depends on actual water quality, ozone demand, hydraulic conditions, operation, commissioning and field verification.

BES Group Thailand
BES GROUP THAILANDEngineering Simulation ReportCOOLING TOWER

Cooling Tower Ozone Sidestream Engineering Simulation Report

BES Preliminary Engineering Design

Page 1 / 6
Generated
Preparing report time
Engineering Core
v0.6.0
Simulation horizon
2 days
Selected model
OWS-1

Project / System Inputs

Project inputs

System type
Cooling Tower
Cooling capacity
200 RT
Basin volume
40 m³
CW Main Circulation Flow
240,000 L/h
Water condition
pH 7.5 - TDS 300 mg/L - 30 C

Ozone Equipment & Schedule

Selected model
OWS-1
Applied Units
1
Capacity / unit
1,000 mg/h
Total Rated Capacity
1,000 mg/h
MTE
60%
Transferred Capacity
600 mg/h
Operating window
24 h/day
ON / OFF / Cycle
60 / 30 / 90 min
Ozone duty cycle
66.67%
Actual ozone ON time
16.00 h/day

Live Hydraulic Recommendation

Selected Model
OWS-1
Equipment Quantity
NOT YET SIZED
Current Units Evaluated
1
Recommended Q-side
3,333.33 L/h
Recommended Q-sub
1,200 L/h
Recommended Contact Zone
40 L
Required T10
2.00 min
Predicted Sidestream Contact CT
1.00 mg·min/L
Recommendation Status
CONTACT + HYDRAULIC GATE ALIGNED

Current Applied Design

Applied Model / Units
1 x OWS-1
Current Q-side
3,333.33 L/h
Current Q-sub
1,200 L/h
Current Contact Zone
40 L
Nominal Contact Time
2.00 min
Estimated T10
2.00 min

WHOLE-SYSTEM OZONE CAPACITY INDICATOR

Transferred Capacity
600 mg/h
Duty / Actual ON Time
66.67% / 16.00 h/day
Daily Transferred O3
9.60 g/day
Daily Transferred O3 Dose
0.24 mg/L/day
BES Group Thailand
BES GROUP THAILANDEngineering Simulation ReportCOOLING TOWER

Engineering System Design

Staged hydraulic arrangement and contact-process design summary

Page 2 / 6
Cooling towerSidestream pumpOWS-1Filter and contact zone
OWS-11,000 mg/h total
Q-side · Ozone Treatment SidestreamWater flow through the independent ozone sidestream.Approved Q-side hydraulic runtime is continuous 24 h/day and remains independent from the ozone operating window.3,333.33 L/h
Q-sub · Ozone Contact Sub-flowSub-flow inside Q-side that receives transferred ozone.Q-sub passes through the Contact Zone and determines C-sub / Contact Inlet C.1,200 L/h
C-sub · Contact InletOzone concentration entering the Q-sub Contact Zone.The BES preliminary target checks contact-inlet concentration.Current applied equipment, Units, MTE and Q-sub influence this value. It does not verify whole-system ozone capacity.0.50 mg/L
Contact Outlet CContact-zone exposure after the modeled contact decay.The BES preliminary target uses Contact Outlet C × T10, never C-sub × nominal time or the operating cycle.Current applied Q-sub, Contact Zone Volume, contact decay and T10 basis influence it. This is WHO-informed engineering guidance, not a regulatory requirement.0.50 mg/L · T10 2.00 min
C-side · Sidestream ReturnOzone concentration after Q-sub is diluted into Q-side.C-side is the sidestream concentration before Basin return.0.18 mg/L
Basin CPredicted ozone residual concentration in the Cooling Tower Basin.Generated by the canonical transient Basin mass balance. KPI #4 compares the final-24h average with the BES Engineering Design Standard; it is not a regulatory limit.0.02 mg/L

Hydraulic Design Summary

Main Circulation
240,000 L/h
Q-side - Ozone Treatment Sidestream Flow
3,333.33 L/h
Q-sub - Ozone Contact Sub-flow
1,200 L/h
Contact Zone Volume
40 L
Nominal Contact Time
2.00 min
Estimated T10
2.00 min - design basis
Q-side Hydraulic Runtime
24 h/day continuous

Contact Process Summary

C-sub / Contact Inlet C
0.50 mg/L
Contact Outlet C
0.50 mg/L
C-side
0.18 mg/L
Basin C
0.02 mg/L
Sidestream Contact CT · CT_sub
1.00 mg·min/L
BES Group Thailand
BES GROUP THAILANDEngineering Simulation ReportCOOLING TOWER

BES Preliminary Design Performance

Five live contact, hydraulic, Basin concentration, and Basin exposure KPIs

Page 3 / 6
KPI #1 · C-sub / Contact Inlet CTreatment Zone: SIDESTREAM CONTACT ZONE0.50mg/LPASS
Formula
Transferred O3 / Q-sub
Substitution
600 mg/h / 1,200 L/h
= 0.50 mg/L
Target
BES Preliminary Design Target >= 0.50 mg/L
Basis
Current applied capacity and Q-sub - Engineering Core result
KPI #2 · SIDESTREAM CONTACT CT · CT_subTreatment Zone: SIDESTREAM CONTACT ZONE1.00mg·min/LPASS
Formula
CT_sub = Contact Outlet C x T10
Substitution
0.50 mg/L x 2.00 min
= 1.00 mg·min/L
Target
BES Preliminary Design Target >= 1.00 mg·min/L
Basis
Canonical Core Sidestream Contact CT - not Basin CT
KPI #3 · SIDESTREAM HYDRAULIC TURNOVERTreatment Zone: INDEPENDENT OZONE SIDESTREAM2.00volumes/dayPASS
Formula
Q-side x Sidestream Hydraulic Runtime / Basin Volume
Substitution
3,333.33 L/h x 24.00 h/day / 40,000 L
= 2.00 volumes/day
Target
BES Preliminary Design Target >= 2.00 volumes/day
Basis
Hydraulic Runtime = 24 h/day continuous - independent from ozone duty
KPI #4 · AVERAGE BASIN OZONE CONCENTRATIONTreatment Zone: COOLING TOWER BASIN0.02mg/LBELOW BES DESIGN STANDARD
Formula
Average Basin O3 = 24-hour Basin CT / 1,440 min
Substitution
32.5791 mg·min/L / 1440 min
= 0.02262 mg/L · 90.5% of standard
Target
BES Basin O3 Design Standard >= 0.025 mg/L
Basis
Final 24-hour average from the current live open-system C_basin(t) response - engineering design evaluation only
KPI #5 · BASIN CT / OZONE EXPOSURETreatment Zone: COOLING TOWER BASIN2.04 cycle · 32.58 daymg·min/LENGINEERING RESULT
Formula
CT_basin = integral C_basin(t) dt · trapezoidal integration
Substitution
1.3630 ON + 0.6732 OFF over 90 min
= 2.0362 mg·min/L/cycle · 32.5791 mg·min/L/day
Target
Engineering result - no approved whole-system acceptance target
Basis
Actual current C_basin(t), including ozone ON and OFF residual periods - never Sidestream Contact CT
BES Group Thailand
BES GROUP THAILANDEngineering Simulation ReportCOOLING TOWER

Basin Ozone and Exposure Over Time

The same live C_basin(t), accumulated Basin CT, C-sub, and C-side series shown on screen

Page 4 / 6

Basin Ozone Concentration

BES Basin O3 Design Standard >= 0.025 mg/L · NOT REGULATORY · Current maximum 0.025 mg/L · Margin +0.000 mg/L

Min 0.020 · Average 0.023 · Max 0.025 mg/L

Open-system C_basin(t) through actual ozone ON and OFF periods.

0.000.010.010.020.030612182430364248BES Basin O3 Design Standard 0.025 mg/LTime (hours)Ozone Concentration (mg/L)

Ozone ON / Ozone OFF comes directly from Core.

Accumulated Basin CT / Ozone Exposure

Actual cumulative trapezoidal ∫ C_basin(t)dt over the final 24h open-system series.

NO APPROVED COOLING-SPECIFIC BASIN EXPOSURE TARGET · LITERATURE REFERENCE OVERLAYS ONLY
0.009.1218.2427.3736.490.006.0012.0018.0024.00E. coli · 0.02Poliovirus 1 low · 0.10Poliovirus 1 high · 0.20Giardia lamblia · 0.63Cryptosporidium · 4.40Legionella pneumophila · 6.00Elapsed Time (hours)Accumulated Exposure (mg·min/L)

Ozone ON / Ozone OFF

C-sub - Contact Inlet C

BES Preliminary Design Target >= 0.50 mg/L · Current maximum 0.500 mg/L · Margin +0.000 mg/L

Sidestream Contact Zone inlet concentration while ozone treatment is ON.

0.000.140.280.410.550612182430364248Target 0.50 mg/LTime (hours)Ozone Concentration (mg/L)

Ozone ON / Ozone OFF comes directly from Core.

C-side - Sidestream Return

N/A · No approved acceptance target

Concentration after Q-sub treatment is diluted into Q-side.

0.000.050.100.150.200612182430364248Time (hours)Ozone Concentration (mg/L)

Ozone ON / Ozone OFF comes directly from Core.

BES Group Thailand
BES GROUP THAILANDEngineering Simulation ReportCOOLING TOWER

Cooling Tower Basin - Microbial Reference Comparison

Numerical literature comparison using the same cumulative modeled Basin CT as KPI #5

Page 5 / 6
Comparison Basis
MODELED BASIN CT / OZONE EXPOSURE
Current Cooling Water
30.0 C · pH 7.50
Modeled Basin CT
2.0362 mg·min/L
Evaluation Architecture
Cumulative trapezoidal CT_basin(t) · up to 168 h / 7 days

REFERENCE CONDITION MISMATCH Current Cooling water conditions are compared with organism-specific published conditions. Temperature correction: NOT APPLIED.

ORGANISM

E. coli

Reference Ozone CT
0.02 mg·min/L
Published Conditions
5°C · pH 6–7
Estimated Time to Reference CT
1.0 min
Modeled Source
Current cumulative Basin CT_basin(t) - not Contact CT

REFERENCE CONDITION MISMATCH
Current: 30.0 C · pH 7.50
Published: 5°C · pH 6–7
Temperature correction: NOT APPLIED

Secondary cycle context: Cycle 1 · 1.0 min · ON period.Source: World Health Organization · Water Treatment and Pathogen Control · Table 3.7Limitations: Applies to the cited water-treatment conditions and suspended organisms; it is not a swimming-pool regulatory standard.
ORGANISM

Poliovirus 1

Reference Ozone CT
0.10–0.20 mg·min/L
Published Conditions
5°C · pH 6–7
Estimated Time to Reference CT
4.9–9.7 min
Modeled Source
Current cumulative Basin CT_basin(t) - not Contact CT

REFERENCE CONDITION MISMATCH
Current: 30.0 C · pH 7.50
Published: 5°C · pH 6–7
Temperature correction: NOT APPLIED

Secondary cycle context: Cycle 1 · 4.9 min · ON period. Upper reference: Cycle 1 · 9.7 min.Source: World Health Organization · Water Treatment and Pathogen Control · Table 3.7Limitations: Applies to the cited water-treatment conditions and suspended organisms; it is not a swimming-pool regulatory standard.
ORGANISM

Giardia lamblia

Reference Ozone CT
0.63 mg·min/L
Published Conditions
15°C · pH 6–9
Estimated Time to Reference CT
29.4 min
Modeled Source
Current cumulative Basin CT_basin(t) - not Contact CT

REFERENCE CONDITION MISMATCH
Current: 30.0 C · pH 7.50
Published: 15°C · pH 6–9
Temperature correction: NOT APPLIED

Secondary cycle context: Cycle 1 · 29.4 min · ON period.Source: World Health Organization · Guidelines for Drinking-water Quality, Third Edition incorporating the First and Second Addenda · Table 7.6Limitations: No automatic temperature interpolation is applied. The cited CT is condition-specific.
ORGANISM

Cryptosporidium

Reference Ozone CT
4.40 mg·min/L
Published Conditions
22°C · pH not stated
Estimated Time to Reference CT
3 hr 16 min
Modeled Source
Current cumulative Basin CT_basin(t) - not Contact CT

REFERENCE CONDITION MISMATCH
Current: 30.0 C · pH 7.50
Published: 22°C · pH not stated
Temperature correction: NOT APPLIED

Secondary cycle context: Cycle 3 · 15.7 min · ON period.Source: World Health Organization · Water Treatment and Pathogen Control · Table 3.9Limitations: Not a universal ozone CT standard. Published CT values vary with temperature, study method and analytical endpoint.
ORGANISM

Legionella pneumophila

Derived Literature Exposure
6.00 mg·min/L
Published Conditions
Temperature not stated · pH not stated
Estimated Time to Reference CT
4 hr 25 min
Modeled Source
Current cumulative Basin CT_basin(t) - not Contact CT

REFERENCE CONDITION MISMATCH
Current: 30.0 C · pH 7.50
Published: Temperature not stated · pH not stated
Temperature correction: NOT APPLIED

Secondary cycle context: Cycle 3 · 84.7 min · OFF period.Source: World Health Organization · Guidelines for Drinking-water Quality, Second Edition, Volume 2: Health Criteria and Other Supporting Information · Legionella chapter · Ozone discussionLimitations: WHO reports that ozone eradication results in real water systems remain ambiguous and that adequate residual/contact time may be difficult to maintain.
BES Group Thailand
BES GROUP THAILANDEngineering Simulation ReportCOOLING TOWER

Engineering Capacity & Design Basis

Current applied capacity calculations, assumptions and limitations

Page 6 / 6

WHOLE-SYSTEM OZONE CAPACITY

ENGINEERING CAPACITY INDICATOR - NO APPROVED ACCEPTANCE TARGET
Transferred Capacity1,000 mg/h x 60%= 600 mg/hOzone Duty60 / (60 + 30)= 66.67%Actual Ozone ON Time24.00 h/day x 66.67%= 16.00 h/dayDaily Transferred O3600 mg/h x 16.00 h/day= 9.60 g/dayDaily Transferred O3 Dose9,600.00 mg/day / 40,000 L= 0.24 mg/L/day

C-sub Basis

Target >= 0.50 mg/L for contact-inlet concentration. It does not independently establish whole-system capacity.

Sidestream Contact CT · CT_sub Basis

Target >= 1.00 mg·min/L. Contact Outlet C x T10; WHO-informed engineering basis.

Sidestream Turnover Basis

Target >= 2.00 volumes/day. Q-side x 24 h/day / Basin Volume; hydraulic coverage only.

Whole-System Capacity Basis

Equipment, Units, MTE, ozone duty and water volume. No approved daily-dose acceptance target exists.

Basin CT / Cycle Basis

CT_basin = integral of C_basin(t) over time; a different evaluation zone from Sidestream Contact CT (CT_sub).

Engineering basis

Engineering Core
@bes/engineering-core@0.6.0
Simulation horizon
2 days
Initial Basin C
0 mg/L - preliminary
Contact-zone decay
Explicit No contact-decay assumption; engineering validation required
T10 basis
Estimated T10 - Design Basis; not a measured hydraulic T10
Basin decay
Provisional BES Decay Estimate from temperature, pH and TDS; not verified and not regulatory.

Design limitations

  • The ozone model is user-selected; BES Units are preliminary.
  • Achieving the C-sub target alone does not verify whole-system equipment adequacy.
  • Final biofilm-control capacity, hydraulics, controls and operating limits require project engineering verification.
  • Estimated T10 is not a measured tracer-study result.

Engineering Review Items

  • Cooling whole-system sizing basis is not approved.
  • Open-system water balance is not represented in the current provisional Basin model.
  • Equipment quantity is not sized.
  • Cooling-specific whole-system acceptance target is not approved.
  • Basin decay uses a provisional BES estimate.
BES ENGINEERING SUPPORT

Turn the selected application into an engineered solution.

Share the site conditions, capacity and operating pattern with BES to confirm system design and product selection.