
BES Preliminary Design Target≥ 0.50 mg/L
STATUSPASS
VIEW CALCULATION
Transferred O₃ ÷ Q-sub600 mg/h ÷ 1,200 L/h= 0.50 mg/LBasis · Current applied capacity and Q-sub · Engineering Core result
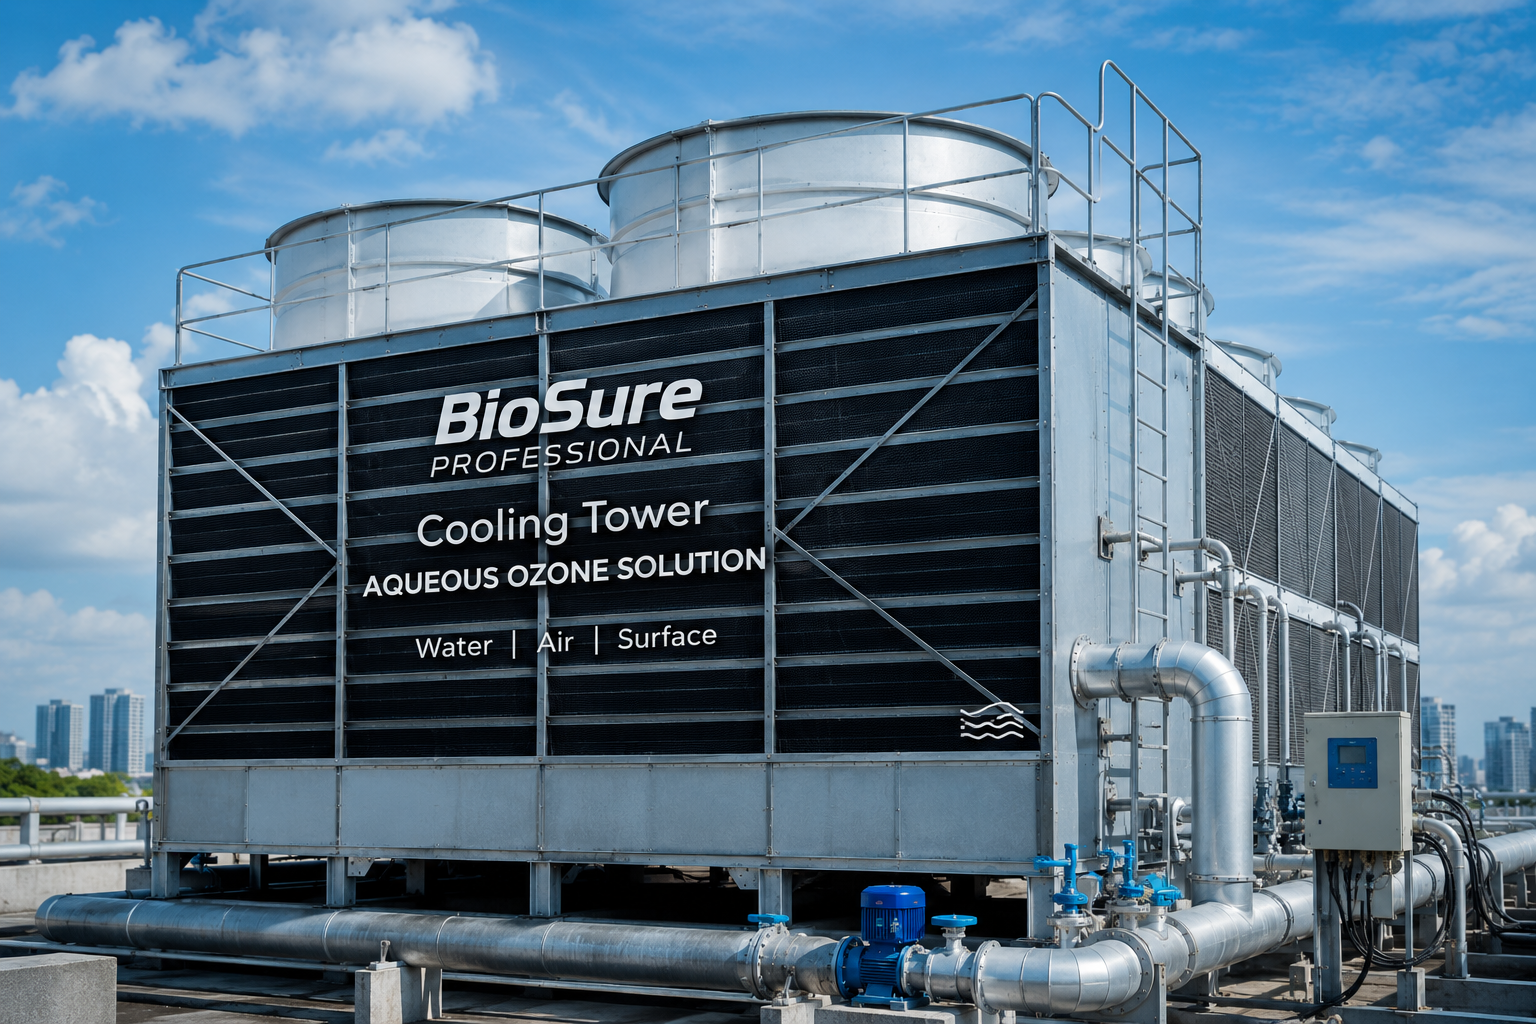
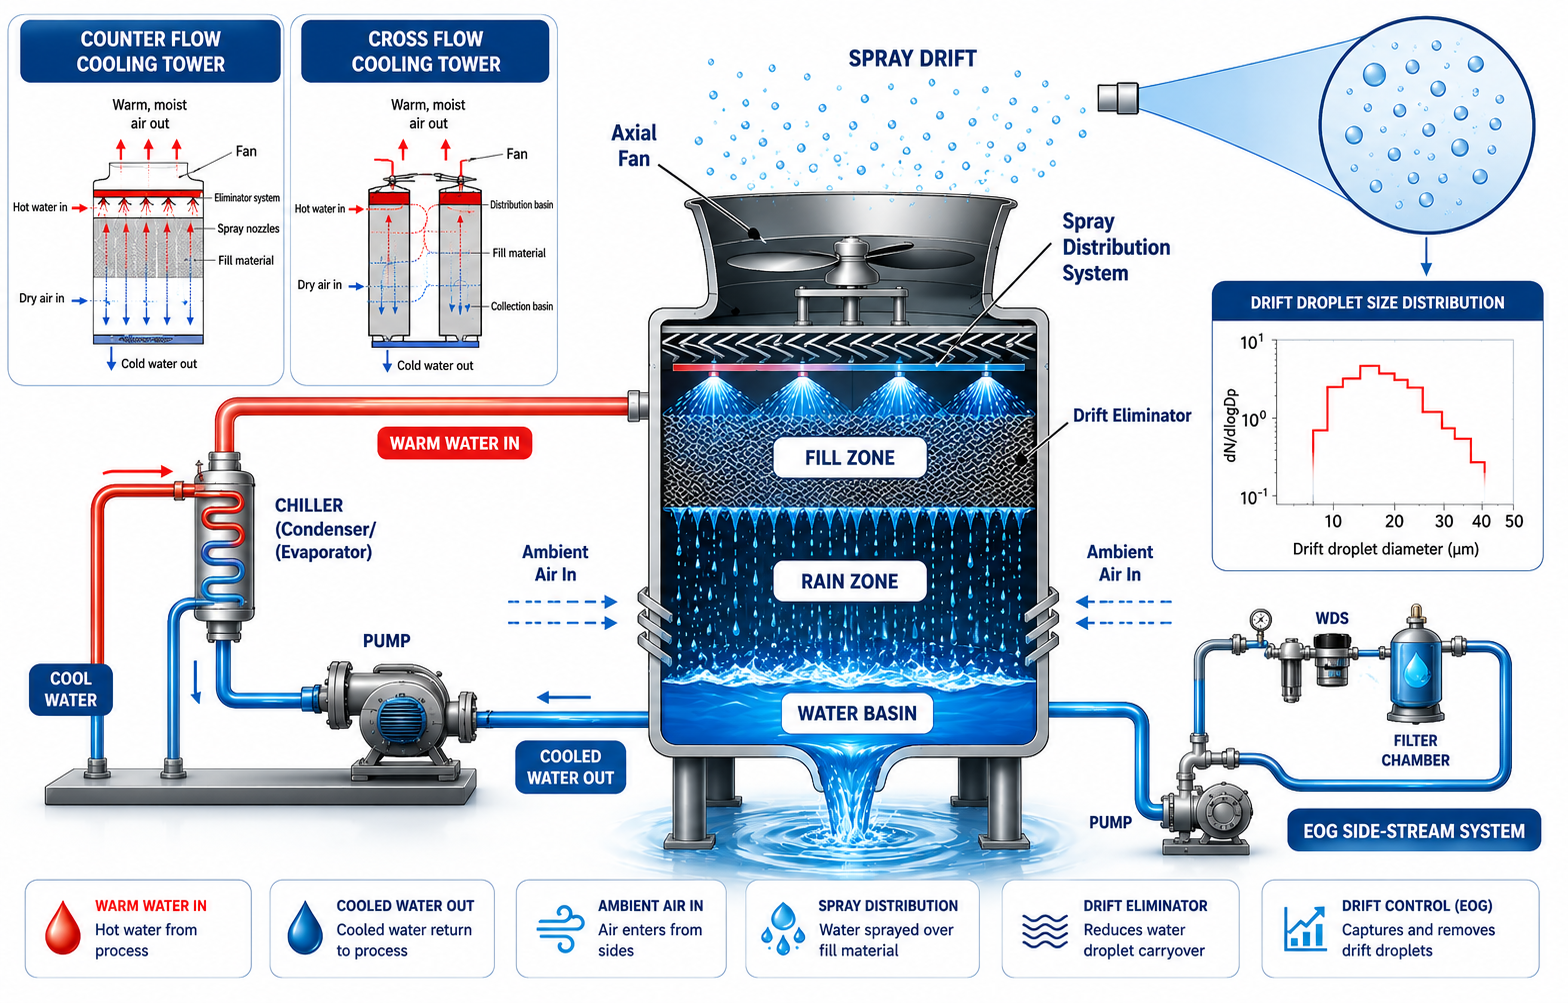
Independent ozone sidestream engineering simulation for cooling tower treatment, covering staged hydraulics, ozone contact performance, Basin residual behavior, and operating cycles using BES Engineering Core v0.6.
ENGINEERING SIMULATION · NOT LIVE TELEMETRY
AUTO-CALCULATED BES RECOMMENDATION
QUANTITY NOT YET SIZEDRECOMMENDATION ALIGNED · 3/3 CONTACT + HYDRAULIC CRITERIA
C_basin(t) = M_O3(t) ÷ V(t) · TRAPEZOIDAL integration · timestep 3 min · 960 intervals.
Water: Makeup 0 L/h · Evaporation 0 L/h · Blowdown 0 L/h · Drift 0 L/h.
Ozone losses: decay, blowdown and drift modeled; stripping and demand follow their explicitly selected basis below.
Stabilization status: NOT VERIFIED — NO APPROVED STABILIZATION CRITERION
CT_basin = ∫ C_basin(t)dt
Basin CT — separate from Sidestream Contact CT · CT_sub = 1.000 mg·min/L
BASIN CT / OZONE EXPOSURE = trapezoidal ∫ C_basin(t)dt from the same open-system series used by KPI #4.
Cycle window: 90 min final complete operating cycle · 24h window: 1440 min · timestep: 3 min.
Sidestream Contact CT (CT_sub) remains a separate contact-zone KPI and its ≥1.00 mg·min/L target is never applied to Basin CT.
BES Basin O3 Design Standard · 0.025 mg/L · NOT REGULATORY · Current maximum 0.025 mg/L · Margin +0.000 mg/L
Min 0.020 · Average 0.023 · Max 0.025 mg/L
Open-system C_basin(t) over the current simulation horizon with actual ozone ON/OFF state.
Ozone ON / Ozone OFF comes directly from Core.
Published organism CT values are compared with the actual cumulative modeled Basin CT. The estimated time is a numerical reference comparison, not a validated inactivation prediction.
COMPARISON BASIS: MODELED BASIN CT. CT_basin = ∫ C_basin(t)dt from the same actual 24-h series used by KPI #5 — not Sidestream Contact CT. No temperature interpolation/correction is applied. Numerical CT comparison does not establish regulatory compliance, guaranteed disinfection, or confirmed organism inactivation.
NUMERICAL REFERENCE COMPARISON ONLY
REFERENCE CT ACCUMULATED WITHIN MODELED CYCLE
Organism: E. coli
Reference CT: 0.02 mg·min/L
Reference outcome: 99% inactivation · 2-log
Temperature / pH: 5°C · pH 6–7
Source organization: World Health Organization
Source document: Water Treatment and Pathogen Control · Table 3.7
Reference type: WHO LITERATURE GUIDELINE REFERENCE
Limitations: Applies to the cited water-treatment conditions and suspended organisms; it is not a swimming-pool regulatory standard.
A. Reference CT: 0.02 mg·min/L
B. Modeled concentration source: C_basin(t) from the current open-system Basin simulation — the same equations and state trajectory used by KPI #5.
C. Cumulative Basin exposure: CT_basin(t) = ∫ C_basin(τ)dτ
D. Initial 24-hour result: CT_basin,24h = 32.5791 mg·min/L
E. Continued integration: Preserve the hour-24 state and continue the current ON/OFF model for up to 168 h.
F. Threshold search: Find the first integrated point where CT_basin(t) ≥ CT_reference, resolving the crossing inside the trapezoidal timestep.
Reference CT: 0.020 mg·min/L
Cumulative Basin CT search: first time CT_basin(t) ≥ CT_reference
Initial 24-hour Basin CT: 32.5791 mg·min/L
Total elapsed: 0.9963 min
Equivalent: 0.02 hr
Converted time: 1.0 min
Cycle length: 60 min ON + 30 min OFF = 90 min
Complete cycles elapsed: floor(0.9963 ÷ 90) = 0
Time into current cycle: 0.9963 mod 90 = 1.00 min
Cycle position: Cycle 1 · 1.00 min into cycle
Reached during: ON period
Average-C approximation only: CT_reference ÷ C_basin,24h,avg ≈ 0.88 min
Actual method: first cumulative trapezoidal CT_basin(t) crossing
MODELED BASIN CT / COMPLETE CYCLE: 2.0362 mg·min/L
Secondary Numerical CT Ratio: 2.0362 ÷ 0.020 = 101.81×
This ratio compares numerical CT magnitude only.
Reference temperature: 5°C
Current water temperature: 30.0°C
Current water pH: 7.50
Temperature correction: NOT APPLIED
Interpretation: Estimated time is a numerical Basin CT accumulation comparison only and is not a validated microbial inactivation prediction under current site conditions.
Source / reference basis: World Health Organization · Water Treatment and Pathogen Control · Table 3.7
NUMERICAL REFERENCE COMPARISON ONLY
REFERENCE CT ACCUMULATED WITHIN MODELED CYCLE
Organism: Poliovirus 1
Reference CT: 0.10–0.20 mg·min/L
Reference outcome: 99% inactivation · 2-log
Temperature / pH: 5°C · pH 6–7
Source organization: World Health Organization
Source document: Water Treatment and Pathogen Control · Table 3.7
Reference type: WHO LITERATURE GUIDELINE REFERENCE
Limitations: Applies to the cited water-treatment conditions and suspended organisms; it is not a swimming-pool regulatory standard.
A. Reference CT: 0.10–0.20 mg·min/L
B. Modeled concentration source: C_basin(t) from the current open-system Basin simulation — the same equations and state trajectory used by KPI #5.
C. Cumulative Basin exposure: CT_basin(t) = ∫ C_basin(τ)dτ
D. Initial 24-hour result: CT_basin,24h = 32.5791 mg·min/L
E. Continued integration: Preserve the hour-24 state and continue the current ON/OFF model for up to 168 h.
F. Threshold search: Find the first integrated point where CT_basin(t) ≥ CT_reference, resolving the crossing inside the trapezoidal timestep.
Lower reference CT: 0.100 mg·min/L
Cumulative Basin CT search: first time CT_basin(t) ≥ CT_reference
Initial 24-hour Basin CT: 32.5791 mg·min/L
Total elapsed: 4.9320 min
Equivalent: 0.08 hr
Converted time: 4.9 min
Cycle length: 60 min ON + 30 min OFF = 90 min
Complete cycles elapsed: floor(4.9320 ÷ 90) = 0
Time into current cycle: 4.9320 mod 90 = 4.93 min
Cycle position: Cycle 1 · 4.93 min into cycle
Reached during: ON period
Average-C approximation only: CT_reference ÷ C_basin,24h,avg ≈ 4.42 min
Actual method: first cumulative trapezoidal CT_basin(t) crossing
Upper reference CT: 0.200 mg·min/L
Cumulative Basin CT search: first time CT_basin(t) ≥ CT_reference
Initial 24-hour Basin CT: 32.5791 mg·min/L
Total elapsed: 9.7483 min
Equivalent: 0.16 hr
Converted time: 9.7 min
Cycle length: 60 min ON + 30 min OFF = 90 min
Complete cycles elapsed: floor(9.7483 ÷ 90) = 0
Time into current cycle: 9.7483 mod 90 = 9.75 min
Cycle position: Cycle 1 · 9.75 min into cycle
Reached during: ON period
Average-C approximation only: CT_reference ÷ C_basin,24h,avg ≈ 8.84 min
Actual method: first cumulative trapezoidal CT_basin(t) crossing
MODELED BASIN CT / COMPLETE CYCLE: 2.0362 mg·min/L
Secondary Numerical CT Ratio: 2.0362 ÷ 0.200 = 10.18× to 2.0362 ÷ 0.100 = 20.36×
This ratio compares numerical CT magnitude only.
Reference temperature: 5°C
Current water temperature: 30.0°C
Current water pH: 7.50
Temperature correction: NOT APPLIED
Interpretation: Estimated time is a numerical Basin CT accumulation comparison only and is not a validated microbial inactivation prediction under current site conditions.
Source / reference basis: World Health Organization · Water Treatment and Pathogen Control · Table 3.7
NUMERICAL REFERENCE COMPARISON ONLY
REFERENCE CT ACCUMULATED WITHIN MODELED CYCLE
Organism: Giardia lamblia
Reference CT: 0.63 mg·min/L
Reference outcome: 99% inactivation · 2-log
Temperature / pH: 15°C · pH 6–9
Source organization: World Health Organization
Source document: Guidelines for Drinking-water Quality, Third Edition incorporating the First and Second Addenda · Table 7.6
Reference type: WHO LITERATURE GUIDELINE REFERENCE
Limitations: No automatic temperature interpolation is applied. The cited CT is condition-specific.
A. Reference CT: 0.63 mg·min/L
B. Modeled concentration source: C_basin(t) from the current open-system Basin simulation — the same equations and state trajectory used by KPI #5.
C. Cumulative Basin exposure: CT_basin(t) = ∫ C_basin(τ)dτ
D. Initial 24-hour result: CT_basin,24h = 32.5791 mg·min/L
E. Continued integration: Preserve the hour-24 state and continue the current ON/OFF model for up to 168 h.
F. Threshold search: Find the first integrated point where CT_basin(t) ≥ CT_reference, resolving the crossing inside the trapezoidal timestep.
Reference CT: 0.630 mg·min/L
Cumulative Basin CT search: first time CT_basin(t) ≥ CT_reference
Initial 24-hour Basin CT: 32.5791 mg·min/L
Total elapsed: 29.3834 min
Equivalent: 0.49 hr
Converted time: 29.4 min
Cycle length: 60 min ON + 30 min OFF = 90 min
Complete cycles elapsed: floor(29.3834 ÷ 90) = 0
Time into current cycle: 29.3834 mod 90 = 29.38 min
Cycle position: Cycle 1 · 29.38 min into cycle
Reached during: ON period
Average-C approximation only: CT_reference ÷ C_basin,24h,avg ≈ 27.85 min
Actual method: first cumulative trapezoidal CT_basin(t) crossing
MODELED BASIN CT / COMPLETE CYCLE: 2.0362 mg·min/L
Secondary Numerical CT Ratio: 2.0362 ÷ 0.630 = 3.23×
This ratio compares numerical CT magnitude only.
Reference temperature: 15°C
Current water temperature: 30.0°C
Current water pH: 7.50
Temperature correction: NOT APPLIED
Interpretation: Estimated time is a numerical Basin CT accumulation comparison only and is not a validated microbial inactivation prediction under current site conditions.
Source / reference basis: World Health Organization · Guidelines for Drinking-water Quality, Third Edition incorporating the First and Second Addenda · Table 7.6
NUMERICAL REFERENCE COMPARISON ONLY
REFERENCE CT ACCUMULATED ACROSS MODELED CYCLES
Organism: Cryptosporidium
Reference CT: 4.40 mg·min/L
Reference outcome: 99% inactivation · 2-log
Temperature / pH: 22°C · pH not stated
Source organization: World Health Organization
Source document: Water Treatment and Pathogen Control · Table 3.9
Reference type: WHO LITERATURE REFERENCE
Limitations: Not a universal ozone CT standard. Published CT values vary with temperature, study method and analytical endpoint.
A. Reference CT: 4.40 mg·min/L
B. Modeled concentration source: C_basin(t) from the current open-system Basin simulation — the same equations and state trajectory used by KPI #5.
C. Cumulative Basin exposure: CT_basin(t) = ∫ C_basin(τ)dτ
D. Initial 24-hour result: CT_basin,24h = 32.5791 mg·min/L
E. Continued integration: Preserve the hour-24 state and continue the current ON/OFF model for up to 168 h.
F. Threshold search: Find the first integrated point where CT_basin(t) ≥ CT_reference, resolving the crossing inside the trapezoidal timestep.
Reference CT: 4.400 mg·min/L
Cumulative Basin CT search: first time CT_basin(t) ≥ CT_reference
Initial 24-hour Basin CT: 32.5791 mg·min/L
Total elapsed: 195.7457 min
Equivalent: 3.26 hr
Converted time: 3 hr 16 min
Cycle length: 60 min ON + 30 min OFF = 90 min
Complete cycles elapsed: floor(195.7457 ÷ 90) = 2
Time into current cycle: 195.7457 mod 90 = 15.75 min
Cycle position: Cycle 3 · 15.75 min into cycle
Reached during: ON period
Average-C approximation only: CT_reference ÷ C_basin,24h,avg ≈ 194.48 min
Actual method: first cumulative trapezoidal CT_basin(t) crossing
MODELED BASIN CT / COMPLETE CYCLE: 2.0362 mg·min/L
Secondary Numerical CT Ratio: 2.0362 ÷ 4.400 = 0.46×
This ratio compares numerical CT magnitude only.
Reference temperature: 22°C
Current water temperature: 30.0°C
Current water pH: 7.50
Temperature correction: NOT APPLIED
Interpretation: Estimated time is a numerical Basin CT accumulation comparison only and is not a validated microbial inactivation prediction under current site conditions.
Source / reference basis: World Health Organization · Water Treatment and Pathogen Control · Table 3.9
NUMERICAL REFERENCE COMPARISON ONLY
REFERENCE CT ACCUMULATED ACROSS MODELED CYCLES
Organism: Legionella pneumophila
Reference CT: 6.00 mg·min/L
Reference outcome: approximately 99.99–99.999% inactivation · 4–5 log
Temperature / pH: Temperature not stated · pH not stated
Source organization: World Health Organization
Source document: Guidelines for Drinking-water Quality, Second Edition, Volume 2: Health Criteria and Other Supporting Information · Legionella chapter · Ozone discussion
Reference type: DERIVED LITERATURE EXPOSURE
Limitations: WHO reports that ozone eradication results in real water systems remain ambiguous and that adequate residual/contact time may be difficult to maintain.
A. Reference CT: 6.00 mg·min/L
B. Modeled concentration source: C_basin(t) from the current open-system Basin simulation — the same equations and state trajectory used by KPI #5.
C. Cumulative Basin exposure: CT_basin(t) = ∫ C_basin(τ)dτ
D. Initial 24-hour result: CT_basin,24h = 32.5791 mg·min/L
E. Continued integration: Preserve the hour-24 state and continue the current ON/OFF model for up to 168 h.
F. Threshold search: Find the first integrated point where CT_basin(t) ≥ CT_reference, resolving the crossing inside the trapezoidal timestep.
Reference CT: 6.000 mg·min/L
Cumulative Basin CT search: first time CT_basin(t) ≥ CT_reference
Initial 24-hour Basin CT: 32.5791 mg·min/L
Total elapsed: 264.6861 min
Equivalent: 4.41 hr
Converted time: 4 hr 25 min
Cycle length: 60 min ON + 30 min OFF = 90 min
Complete cycles elapsed: floor(264.6861 ÷ 90) = 2
Time into current cycle: 264.6861 mod 90 = 84.69 min
Cycle position: Cycle 3 · 84.69 min into cycle
Reached during: OFF period
Average-C approximation only: CT_reference ÷ C_basin,24h,avg ≈ 265.20 min
Actual method: first cumulative trapezoidal CT_basin(t) crossing
MODELED BASIN CT / COMPLETE CYCLE: 2.0362 mg·min/L
Secondary Numerical CT Ratio: 2.0362 ÷ 6.000 = 0.34×
This ratio compares numerical CT magnitude only.
Reference temperature: Not stated
Current water temperature: 30.0°C
Current water pH: 7.50
Temperature correction: NOT APPLIED
Interpretation: Estimated time is a numerical Basin CT accumulation comparison only and is not a validated microbial inactivation prediction under current site conditions.
Source / reference basis: World Health Organization · Guidelines for Drinking-water Quality, Second Edition, Volume 2: Health Criteria and Other Supporting Information · Legionella chapter · Ozone discussion
Cooling-specific whole-system acceptance criteria have not yet been approved.
Cooling RT remains CONTEXT / OPTIONAL WATER-BALANCE BASIS and is not used to derive evaporation or ozone demand. All zero values below are visible operator inputs; no coefficient is hidden.
Water: dV/dt = Q_makeup − Q_evap − Q_blowdown − Q_drift − Q_other_loss
Ozone: dM/dt = Ṁ_after-contact − decay − blowdown − drift − stripping − demand
No approved Cooling System ozone acceptance target exists.
Cooling equipment quantity remains not yet sized.
Evaporation changes water inventory but is not treated as a dissolved-ozone liquid loss.
AIR STRIPPING NOT YET MODELED.
CHEMICAL / BIOLOGICAL OZONE DEMAND NOT CONFIGURED.
2-day internal horizon · Initial Basin C 0 mg/L · no additional contact-zone decay assumed · Estimated T10 is not measured · Basin decay is a Provisional BES Decay Estimate.
Current-applied Contact Inlet and Sidestream Return graph diagnostics.
BES Preliminary Design Target ≥ 0.50 mg/L · Current maximum 0.500 mg/L · Margin +0.000 mg/L
Contact-zone inlet ozone concentration while ozone treatment is ON.
Ozone ON / Ozone OFF comes directly from Core.
N/A · No approved acceptance target
Ozone concentration after Q-sub treatment is diluted back into Q-side.
Ozone ON / Ozone OFF comes directly from Core.
Contact concentration target only. It does not verify whole-system ozone capacity.
Contact Outlet C × T10. This is a BES preliminary contact-process design target, not a Pool exposure target or regulatory requirement. Any organism-specific comparison requires an approved, explicitly provenanced reference dataset and defined operating conditions.
Q-side × 24 h/day ÷ Basin Volume. The approved Q-side hydraulic runtime is continuous 24 h/day and remains independent from ozone generator duty.
Daily transferred ozone mass and normalized dose expose equipment scale. They remain separate from contact and hydraulic coverage PASS/FAIL.
PASS means the current applied design meets all three BES preliminary contact and hydraulic coverage targets. It does not by itself establish final whole-system ozone capacity, equipment suitability, regulatory certification or third-party microbial validation. Final performance depends on actual water quality, ozone demand, hydraulic conditions, operation, commissioning and field verification.

BES Preliminary Engineering Design
Staged hydraulic arrangement and contact-process design summary
Five live contact, hydraulic, Basin concentration, and Basin exposure KPIs
The same live C_basin(t), accumulated Basin CT, C-sub, and C-side series shown on screen
BES Basin O3 Design Standard >= 0.025 mg/L · NOT REGULATORY · Current maximum 0.025 mg/L · Margin +0.000 mg/L
Min 0.020 · Average 0.023 · Max 0.025 mg/L
Open-system C_basin(t) through actual ozone ON and OFF periods.
Ozone ON / Ozone OFF comes directly from Core.
Actual cumulative trapezoidal ∫ C_basin(t)dt over the final 24h open-system series.
Ozone ON / Ozone OFF
BES Preliminary Design Target >= 0.50 mg/L · Current maximum 0.500 mg/L · Margin +0.000 mg/L
Sidestream Contact Zone inlet concentration while ozone treatment is ON.
Ozone ON / Ozone OFF comes directly from Core.
N/A · No approved acceptance target
Concentration after Q-sub treatment is diluted into Q-side.
Ozone ON / Ozone OFF comes directly from Core.
Numerical literature comparison using the same cumulative modeled Basin CT as KPI #5
REFERENCE CONDITION MISMATCH Current Cooling water conditions are compared with organism-specific published conditions. Temperature correction: NOT APPLIED.
REFERENCE CONDITION MISMATCH
Current: 30.0 C · pH 7.50
Published: 5°C · pH 6–7
Temperature correction: NOT APPLIED
REFERENCE CONDITION MISMATCH
Current: 30.0 C · pH 7.50
Published: 5°C · pH 6–7
Temperature correction: NOT APPLIED
REFERENCE CONDITION MISMATCH
Current: 30.0 C · pH 7.50
Published: 15°C · pH 6–9
Temperature correction: NOT APPLIED
REFERENCE CONDITION MISMATCH
Current: 30.0 C · pH 7.50
Published: 22°C · pH not stated
Temperature correction: NOT APPLIED
REFERENCE CONDITION MISMATCH
Current: 30.0 C · pH 7.50
Published: Temperature not stated · pH not stated
Temperature correction: NOT APPLIED
Current applied capacity calculations, assumptions and limitations
Target >= 0.50 mg/L for contact-inlet concentration. It does not independently establish whole-system capacity.
Target >= 1.00 mg·min/L. Contact Outlet C x T10; WHO-informed engineering basis.
Target >= 2.00 volumes/day. Q-side x 24 h/day / Basin Volume; hydraulic coverage only.
Equipment, Units, MTE, ozone duty and water volume. No approved daily-dose acceptance target exists.
CT_basin = integral of C_basin(t) over time; a different evaluation zone from Sidestream Contact CT (CT_sub).
Share the site conditions, capacity and operating pattern with BES to confirm system design and product selection.