
ODB · DENTAL UNIT WATERLINESClean Dental
0–<1 CFU/mLObserved in documented real Dental Unit installations NO DAILYDisinfectant tablets NO BOTTLERemoval for normal refill
Clean Dental
Water.
Simply Open
the Valve.
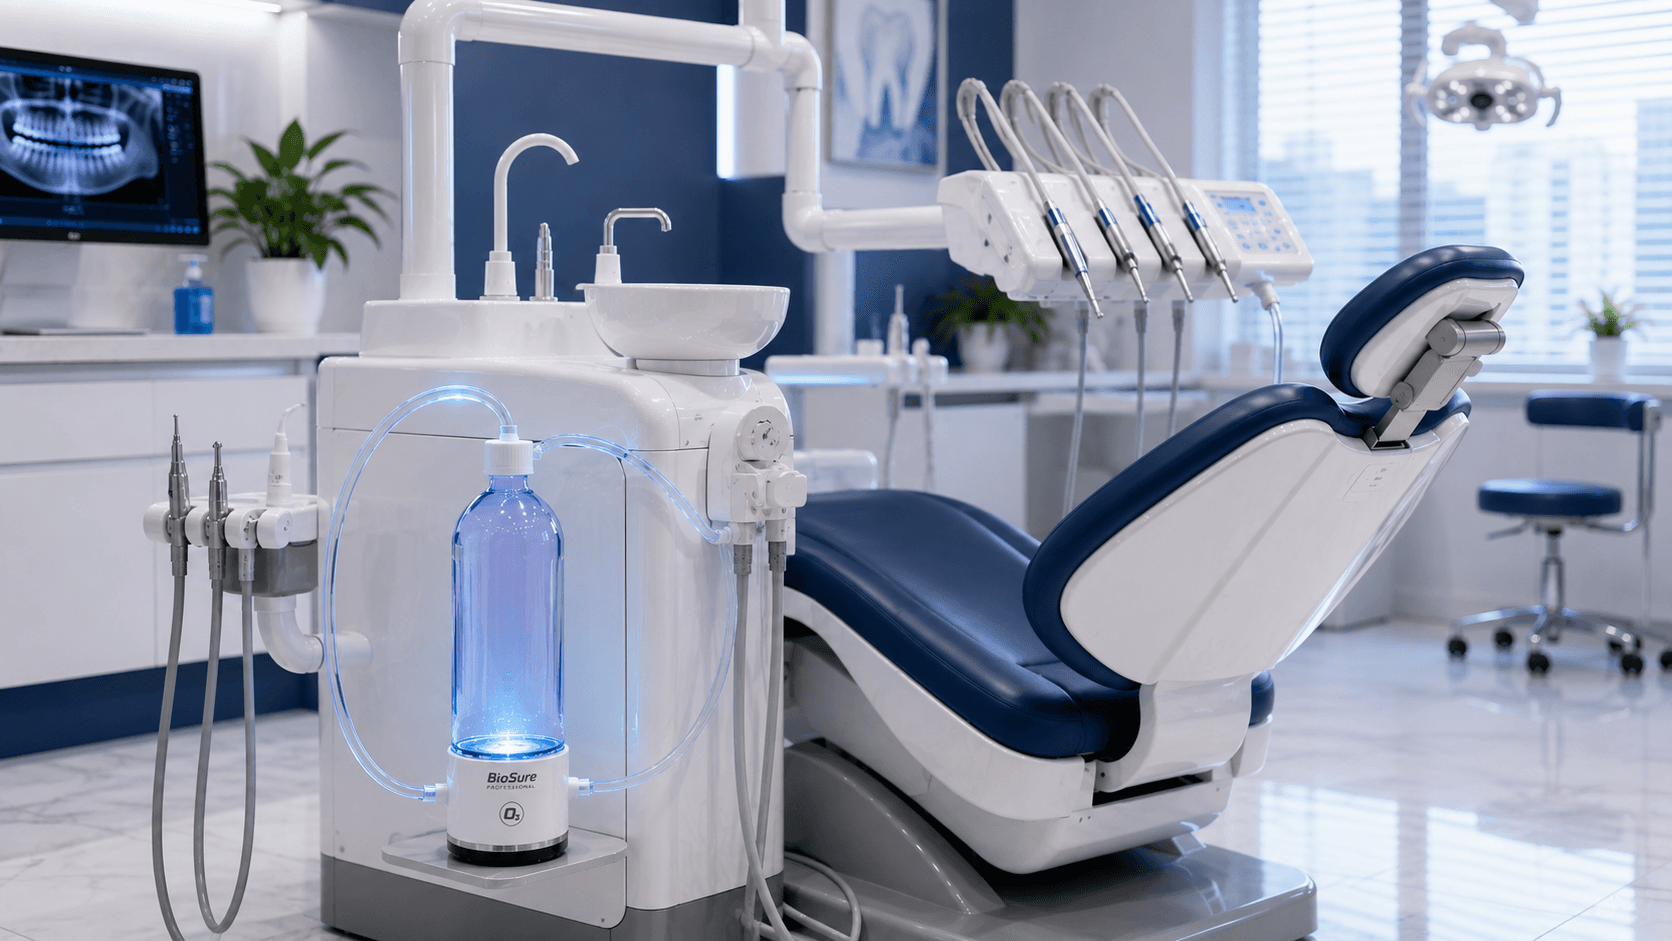
On-site aqueous ozone for Dental Unit Waterlines — without daily disinfectant tablets or bottle removal.
WHY ODB
Four changes to the daily workflow.
Less daily handling
A simpler routine for the team operating each Dental Unit.
No daily disinfectant tablet
Reduce recurring treatment consumables and preparation steps.
No routine bottle removal
Refill normally through the valve without removing the bottle.
On-site treatment
Aqueous ozone is generated on-site as water is filled.
REAL-WORLD DENTAL INSTALLATION EVIDENCE
0–<1 CFU/mL
Observed in tested Dental Unit installations. Report-specific field results; not a universal ODB specification or guarantee.
2Independent laboratory
evidence records
evidence records
REAL INSTALLATIONS. INDEPENDENT LABORATORY RESULTS.
ODB performance has been evaluated from water samples collected after installation in real Dental environments — including a hospital Dental Unit setting and the Institute of Dentistry, Department of Medical Services.
YANHEE HOSPITAL
0CFU/mLObserved laboratory result
The documented result applies only to the tested Dental Unit outlet specimens; it is not a universal performance guarantee.
- Medica Laboratories
- Spread Plate on TSA
- 20 Oct 2025
- ISO 15189
Triple Syringe · Cup Filler · Rotor / Handpiece
INSTITUTE OF DENTISTRY
DEPARTMENT OF MEDICAL SERVICES
DEPARTMENT OF MEDICAL SERVICES
<1CFU/mLTotal Plate Count
The report covers the documented Total Plate Count result for a Dental treatment-room water sample after ODB installation.
- AMARC
- APHA/AWWA/WEF 9215B
- 06 Jul 2026
- ISO/IEC 17025
Floor 5 · Room 9
CHX / ICX CONTEXT
Compare the operating workflow, not just the treatment name.
Product protocols vary. Confirm the manufacturer instructions and evidence for the exact treatment used at your facility.
Chlorhexidine-based chemistry
Review recurring consumables, preparation and refill steps, staff handling, residue considerations, and operating cost.
Product-specific chemistry
Composition and protocol must be verified from the specific product evidence. Evaluate consumables, handling, and workflow burden.
On-site aqueous ozone
Open the valve and fill. Treatment is generated on-site without a daily disinfectant tablet or routine bottle removal.
This educational context is not a head-to-head clinical efficacy claim and does not replace product-specific instructions.
WATERLINE QUALITY MANAGEMENT
A controlled, repeatable workflow.
ODB can support a documented Dental waterline-management process. JCI does not require ODB, and this is not a claim of JCI endorsement or certification.
01Defined procedure
02Routine monitoring
03Documented results
04Corrective action
05Traceability
Water quality is essential.
But achieving it every working day also raises an operational question: how much treatment, bottle handling, and recurring consumable does one Dental Unit require each year?
CHEMICAL TABLET VS ODB
Two daily waterline workflows.
CHEMICAL TABLET
Repeated handling01Tablet / chemical
02Prepare and refill bottle
03Repeat during operation
04Recurring consumable and handling
Recurring consumable · preparation and refill workflow · repeated staff handling
ODB
Simplified refill01Open valve
02Fill
03Aqueous ozone generated on-site
04Ready for normal Dental Unit use
No bottle removal. No daily disinfectant tablet.
OPENFILLCONTINUE
One Dental Unit × Daily water use × Bottle refills × Operating days × Treatment-tablet cost
QUICK SAVINGS CHECK · PER ONE DENTAL UNIT
What does daily waterline treatment really cost?
One Dental Unit uses one ODB system. Enter the current workflow for that single Dental Unit; no quantity multiplier is applied.
QUICK CHECK1 Dental Unit = 1 ODB System
All public results below are calculated for one Dental Unit.
Calculate price per tablet from a pack
Advanced assumptions
Checking website access…
COMPARE WITH ODB
TCO that includes EOG replacement
ODB price, EOG life, replacement, service, and electricity remain blank until you enter verified project values.
Checking website access…
SIMPLE BUYING COMPARISON
Choose the operating workflow you want to manage.
Chemical tablet system
- Treatment consumable
- Recurring
- Bottle removal
- Typically required in bottle refill workflow
- Treatment step
- Repeated
- On-site generation
- No
ODB
- Daily disinfectant tablet
- No
- Bottle removal for normal refill
- No
- Refill
- Open valve
- On-site aqueous ozone
- Yes
- Real Dental installation evidence
- 0–<1 CFU/mL observed
Hospital Quality / Technical ReferenceOpen ODB reservoir engineering model
The existing ODB operating-cycle and reservoir concentration model is retained as technical context. It is separate from field microbiology results and commercial cost assumptions.
QUICK SIMULATION
ODB 16 mg/h ozone simulation
Estimated ozone concentration over one approved 60-minute soaking simulation under constant and changing water-volume conditions.
ODB output: 16 mg/h · concentration curves preserve the existing 60-minute engineering model.
Constant 1 L Water · 1 Hour
Reference condition where the water volume remains fixed during the simulation.
Peak O₃1.52 ppm
Average O₃0.90 ppm
Runtime60 min
Variable Water Volume · 1 Hour
Real-use reference where water volume changes during operation and refill behavior may occur.
Peak O₃1.68 ppm
Average O₃1.13 ppm
Runtime60 min
Left graph conditionsConstant water volume at 1L, ODB output fixed at 16 mg/h, ozone loss included.
Right graph conditionsVariable water volume with refill behavior. Blue line shows ozone concentration; orange line shows water volume.
YOUR NEXT DECISIONReady to simplify
Ready to simplify
Dental waterline management?
See what ODB could save for one Dental Unit.