
02 · AI ENGINEERING DESIGN
Deterministic recommendation
REVIEW
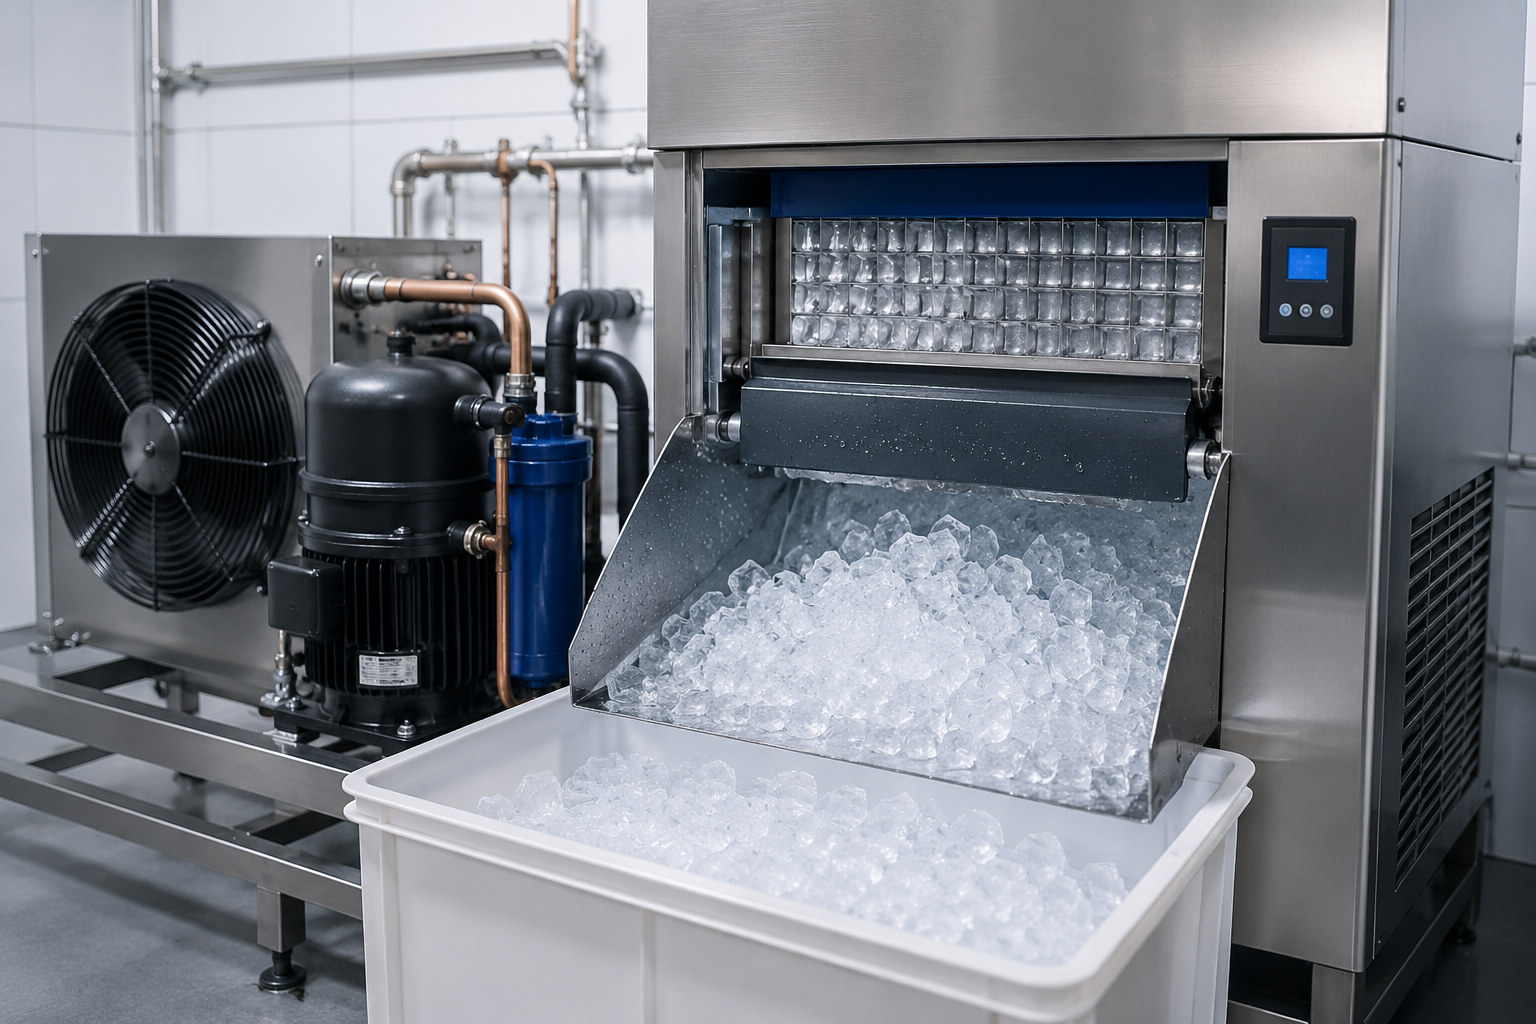
AI Recommended ProductWDS600X
Recommendation Reason220 lb/day is within the approved UF commercial rule of ≤ 700 lb/day.
Operating LogicEstimated batch filling · 3 min/fill × 24 fills/day
Overall StatusREVIEW
Failure / Review ReasonResidual above the design target; optimization is available.
Suggested CorrectionReduce runtime or duty cycle; a smaller product may also be evaluated.
03 · BES ENGINEERING DIAGRAM
Batch-filled Water Basin Protection
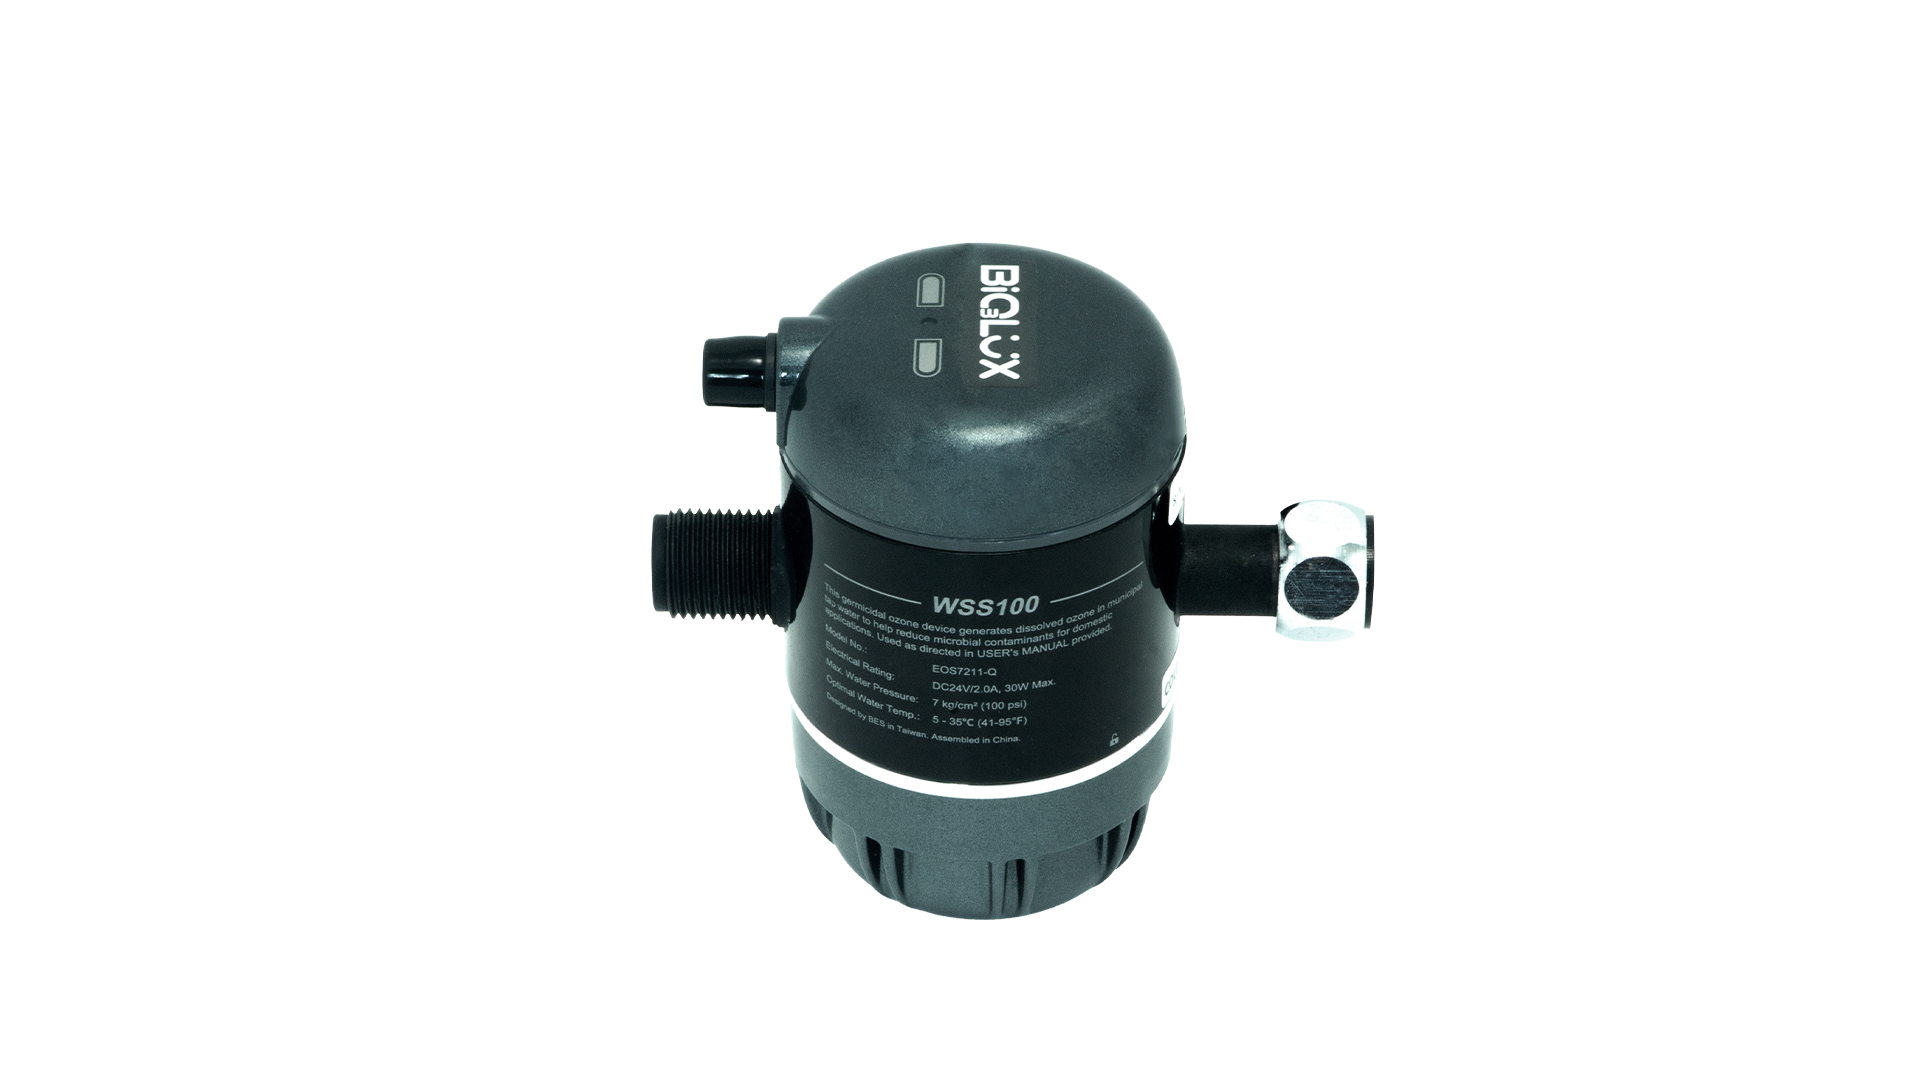
PROBLEMBatch-water riskPROTECTION POINTMachine Water BasinESTIMATED RESIDUAL0.384 mg/LWATER PER FILLEstimated batch demandPRODUCTWDS600XESTIMATED LIFEBatch-fill runtime basis
LIVE PROTECTIONOzone-treated make-up water enters the Water Basin during each filling event.
04 · PERFORMANCE SUMMARY
Current engineering performance
Overall Engineering StatusREVIEW
Estimated Batch Schedule24 fills/day · 3 min/fill · 1.2 hr/day
Estimated Residual BasisDissolved EOG output ÷ estimated fill flow
Product Capacity MatchPASS · WDS600X
Primary Decision ReasonResidual above the design target; optimization is available.