
เกณฑ์การออกแบบเบื้องต้นของ BES≥ 0.50 mg/L
สถานะผ่านเกณฑ์ · PASS
ดูการคำนวณ
Transferred O₃ ÷ Q-sub600 mg/h ÷ 1,200 L/h= 0.50 mg/Lหลักเกณฑ์ · Current applied capacity and Q-sub · Engineering Core result
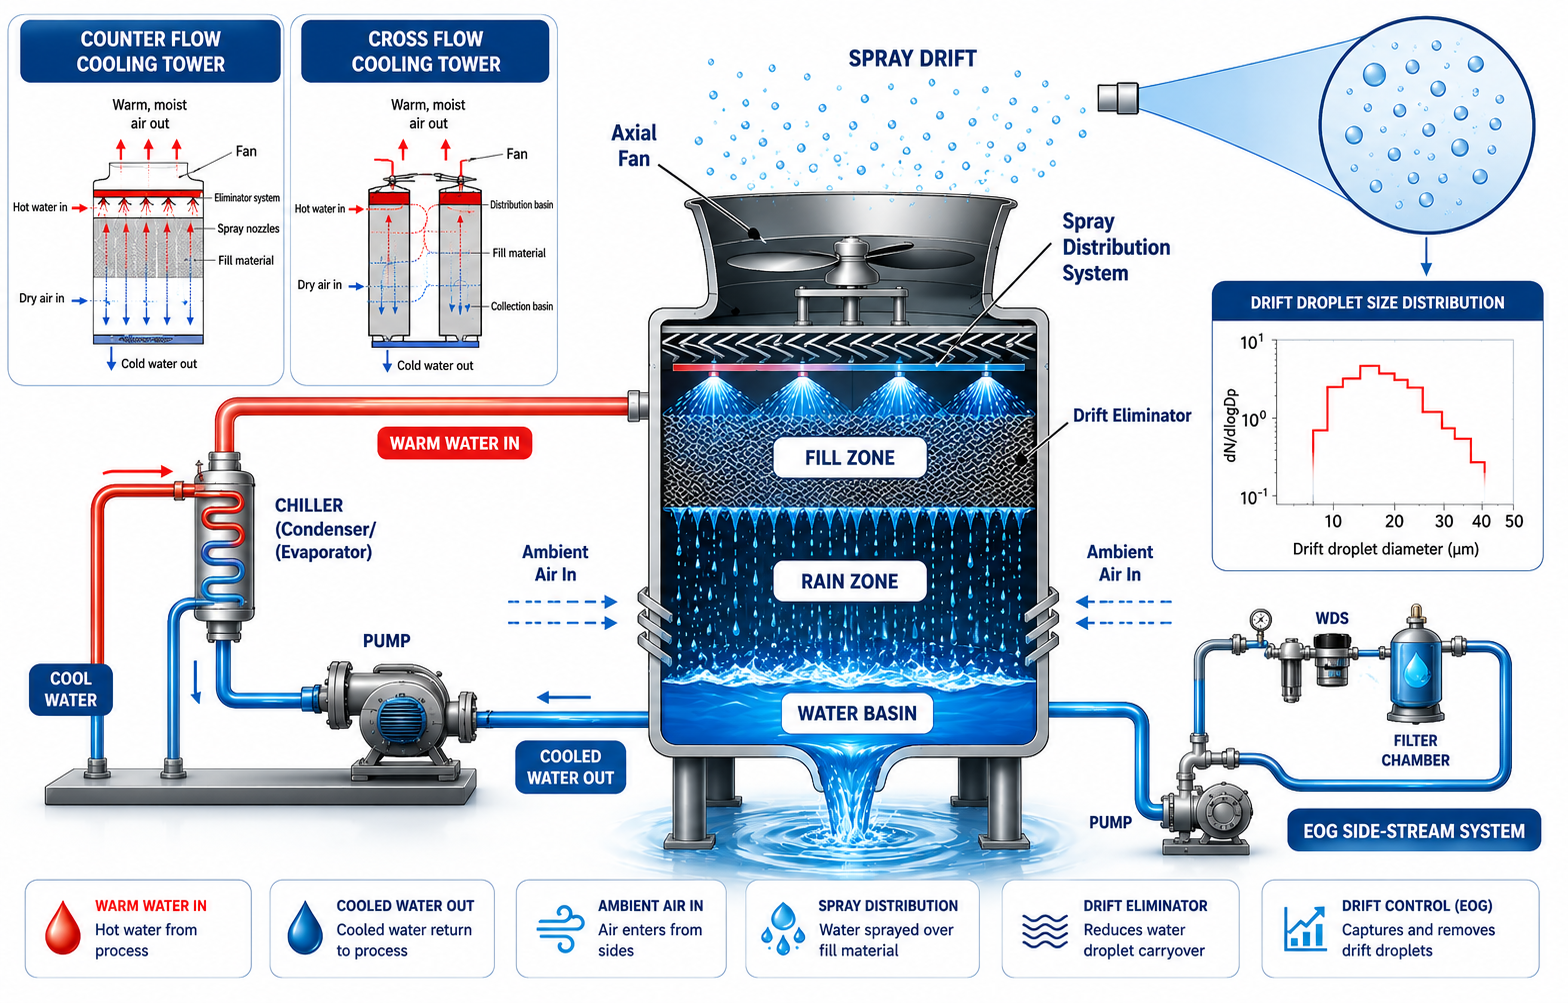
แบบจำลองทางวิศวกรรมของระบบโอโซน Sidestream แยกอิสระ ครอบคลุมระบบไฮดรอลิกเป็นลำดับ โซนสัมผัส การตอบสนองของอ่างพักน้ำ (Basin) รอบเดินเครื่อง และข้อมูลตัวเลขในรายงาน
แบบจำลองทางวิศวกรรม · ไม่ใช่ข้อมูลสด
แบบแนะนำของ BES ที่คำนวณอัตโนมัติ
ยังไม่ได้กำหนดจำนวนอุปกรณ์RECOMMENDATION ALIGNED · 3/3 CONTACT + HYDRAULIC CRITERIA
C_basin(t) = M_O3(t) ÷ V(t) · TRAPEZOIDAL integration · timestep 3 min · 960 intervals.
Water: Makeup 0 L/h · Evaporation 0 L/h · Blowdown 0 L/h · Drift 0 L/h.
Ozone losses: decay, blowdown and drift modeled; stripping and demand follow their explicitly selected basis below.
Stabilization status: NOT VERIFIED — NO APPROVED STABILIZATION CRITERION
CT_basin = ∫ C_basin(t)dt
Basin CT — separate from Sidestream Contact CT · CT_sub = 1.000 mg·min/L
BASIN CT / OZONE EXPOSURE = trapezoidal ∫ C_basin(t)dt from the same open-system series used by KPI #4.
Cycle window: 90 min final complete operating cycle · 24h window: 1440 min · timestep: 3 min.
Sidestream Contact CT (CT_sub) remains a separate contact-zone KPI and its ≥1.00 mg·min/L target is never applied to Basin CT.
BES Basin O3 Design Standard · 0.025 mg/L · NOT REGULATORY · Current maximum 0.025 mg/L · Margin +0.000 mg/L
Min 0.020 · Average 0.023 · Max 0.025 mg/L
Open-system C_basin(t) over the current simulation horizon with actual ozone ON/OFF state.
Ozone ON / Ozone OFF comes directly from Core.
เปรียบเทียบค่า CT ของจุลชีพจากเอกสารเผยแพร่กับค่า CT สะสมจริงจากแบบจำลอง Basin เวลาที่ประมาณการเป็นการเปรียบเทียบเชิงตัวเลข ไม่ใช่ผลยืนยันการลดเชื้อ
หลักเกณฑ์การเปรียบเทียบ: ค่า CT ของ Basin จากแบบจำลอง โดย CT_basin = ∫ C_basin(t)dt จากอนุกรมจริง 24 ชั่วโมงชุดเดียวกับ KPI #5 ไม่ใช่ Sidestream Contact CT ไม่มีการประมาณค่าหรือปรับแก้อุณหภูมิ การเปรียบเทียบค่า CT เชิงตัวเลขไม่ใช่การรับรองตามกฎหมาย การรับประกันการฆ่าเชื้อ หรือการยืนยันการลดเชื้อ
เปรียบเทียบค่าอ้างอิงเชิงตัวเลขเท่านั้น
REFERENCE CT ACCUMULATED WITHIN MODELED CYCLE
Organism: E. coli
Reference CT: 0.02 mg·min/L
Reference outcome: 99% inactivation · 2-log
Temperature / pH: 5°C · pH 6–7
Source organization: World Health Organization
Source document: Water Treatment and Pathogen Control · Table 3.7
Reference type: WHO LITERATURE GUIDELINE REFERENCE
Limitations: Applies to the cited water-treatment conditions and suspended organisms; it is not a swimming-pool regulatory standard.
A. Reference CT: 0.02 mg·min/L
B. Modeled concentration source: C_basin(t) from the current open-system Basin simulation — the same equations and state trajectory used by KPI #5.
C. Cumulative Basin exposure: CT_basin(t) = ∫ C_basin(τ)dτ
D. Initial 24-hour result: CT_basin,24h = 32.5791 mg·min/L
E. Continued integration: Preserve the hour-24 state and continue the current ON/OFF model for up to 168 h.
F. Threshold search: Find the first integrated point where CT_basin(t) ≥ CT_reference, resolving the crossing inside the trapezoidal timestep.
Reference CT: 0.020 mg·min/L
Cumulative Basin CT search: first time CT_basin(t) ≥ CT_reference
Initial 24-hour Basin CT: 32.5791 mg·min/L
Total elapsed: 0.9963 min
Equivalent: 0.02 hr
Converted time: 1.0 min
Cycle length: 60 min ON + 30 min OFF = 90 min
Complete cycles elapsed: floor(0.9963 ÷ 90) = 0
Time into current cycle: 0.9963 mod 90 = 1.00 min
Cycle position: Cycle 1 · 1.00 min into cycle
Reached during: ON period
Average-C approximation only: CT_reference ÷ C_basin,24h,avg ≈ 0.88 min
Actual method: first cumulative trapezoidal CT_basin(t) crossing
ค่า CT ของ Basin จากแบบจำลอง / หนึ่งรอบสมบูรณ์: 2.0362 mg·min/L
Secondary Numerical CT Ratio: 2.0362 ÷ 0.020 = 101.81×
This ratio compares numerical CT magnitude only.
Reference temperature: 5°C
Current water temperature: 30.0°C
Current water pH: 7.50
Temperature correction: NOT APPLIED
Interpretation: Estimated time is a numerical Basin CT accumulation comparison only and is not a validated microbial inactivation prediction under current site conditions.
Source / reference basis: World Health Organization · Water Treatment and Pathogen Control · Table 3.7
เปรียบเทียบค่าอ้างอิงเชิงตัวเลขเท่านั้น
REFERENCE CT ACCUMULATED WITHIN MODELED CYCLE
Organism: Poliovirus 1
Reference CT: 0.10–0.20 mg·min/L
Reference outcome: 99% inactivation · 2-log
Temperature / pH: 5°C · pH 6–7
Source organization: World Health Organization
Source document: Water Treatment and Pathogen Control · Table 3.7
Reference type: WHO LITERATURE GUIDELINE REFERENCE
Limitations: Applies to the cited water-treatment conditions and suspended organisms; it is not a swimming-pool regulatory standard.
A. Reference CT: 0.10–0.20 mg·min/L
B. Modeled concentration source: C_basin(t) from the current open-system Basin simulation — the same equations and state trajectory used by KPI #5.
C. Cumulative Basin exposure: CT_basin(t) = ∫ C_basin(τ)dτ
D. Initial 24-hour result: CT_basin,24h = 32.5791 mg·min/L
E. Continued integration: Preserve the hour-24 state and continue the current ON/OFF model for up to 168 h.
F. Threshold search: Find the first integrated point where CT_basin(t) ≥ CT_reference, resolving the crossing inside the trapezoidal timestep.
Lower reference CT: 0.100 mg·min/L
Cumulative Basin CT search: first time CT_basin(t) ≥ CT_reference
Initial 24-hour Basin CT: 32.5791 mg·min/L
Total elapsed: 4.9320 min
Equivalent: 0.08 hr
Converted time: 4.9 min
Cycle length: 60 min ON + 30 min OFF = 90 min
Complete cycles elapsed: floor(4.9320 ÷ 90) = 0
Time into current cycle: 4.9320 mod 90 = 4.93 min
Cycle position: Cycle 1 · 4.93 min into cycle
Reached during: ON period
Average-C approximation only: CT_reference ÷ C_basin,24h,avg ≈ 4.42 min
Actual method: first cumulative trapezoidal CT_basin(t) crossing
Upper reference CT: 0.200 mg·min/L
Cumulative Basin CT search: first time CT_basin(t) ≥ CT_reference
Initial 24-hour Basin CT: 32.5791 mg·min/L
Total elapsed: 9.7483 min
Equivalent: 0.16 hr
Converted time: 9.7 min
Cycle length: 60 min ON + 30 min OFF = 90 min
Complete cycles elapsed: floor(9.7483 ÷ 90) = 0
Time into current cycle: 9.7483 mod 90 = 9.75 min
Cycle position: Cycle 1 · 9.75 min into cycle
Reached during: ON period
Average-C approximation only: CT_reference ÷ C_basin,24h,avg ≈ 8.84 min
Actual method: first cumulative trapezoidal CT_basin(t) crossing
ค่า CT ของ Basin จากแบบจำลอง / หนึ่งรอบสมบูรณ์: 2.0362 mg·min/L
Secondary Numerical CT Ratio: 2.0362 ÷ 0.200 = 10.18× to 2.0362 ÷ 0.100 = 20.36×
This ratio compares numerical CT magnitude only.
Reference temperature: 5°C
Current water temperature: 30.0°C
Current water pH: 7.50
Temperature correction: NOT APPLIED
Interpretation: Estimated time is a numerical Basin CT accumulation comparison only and is not a validated microbial inactivation prediction under current site conditions.
Source / reference basis: World Health Organization · Water Treatment and Pathogen Control · Table 3.7
เปรียบเทียบค่าอ้างอิงเชิงตัวเลขเท่านั้น
REFERENCE CT ACCUMULATED WITHIN MODELED CYCLE
Organism: Giardia lamblia
Reference CT: 0.63 mg·min/L
Reference outcome: 99% inactivation · 2-log
Temperature / pH: 15°C · pH 6–9
Source organization: World Health Organization
Source document: Guidelines for Drinking-water Quality, Third Edition incorporating the First and Second Addenda · Table 7.6
Reference type: WHO LITERATURE GUIDELINE REFERENCE
Limitations: No automatic temperature interpolation is applied. The cited CT is condition-specific.
A. Reference CT: 0.63 mg·min/L
B. Modeled concentration source: C_basin(t) from the current open-system Basin simulation — the same equations and state trajectory used by KPI #5.
C. Cumulative Basin exposure: CT_basin(t) = ∫ C_basin(τ)dτ
D. Initial 24-hour result: CT_basin,24h = 32.5791 mg·min/L
E. Continued integration: Preserve the hour-24 state and continue the current ON/OFF model for up to 168 h.
F. Threshold search: Find the first integrated point where CT_basin(t) ≥ CT_reference, resolving the crossing inside the trapezoidal timestep.
Reference CT: 0.630 mg·min/L
Cumulative Basin CT search: first time CT_basin(t) ≥ CT_reference
Initial 24-hour Basin CT: 32.5791 mg·min/L
Total elapsed: 29.3834 min
Equivalent: 0.49 hr
Converted time: 29.4 min
Cycle length: 60 min ON + 30 min OFF = 90 min
Complete cycles elapsed: floor(29.3834 ÷ 90) = 0
Time into current cycle: 29.3834 mod 90 = 29.38 min
Cycle position: Cycle 1 · 29.38 min into cycle
Reached during: ON period
Average-C approximation only: CT_reference ÷ C_basin,24h,avg ≈ 27.85 min
Actual method: first cumulative trapezoidal CT_basin(t) crossing
ค่า CT ของ Basin จากแบบจำลอง / หนึ่งรอบสมบูรณ์: 2.0362 mg·min/L
Secondary Numerical CT Ratio: 2.0362 ÷ 0.630 = 3.23×
This ratio compares numerical CT magnitude only.
Reference temperature: 15°C
Current water temperature: 30.0°C
Current water pH: 7.50
Temperature correction: NOT APPLIED
Interpretation: Estimated time is a numerical Basin CT accumulation comparison only and is not a validated microbial inactivation prediction under current site conditions.
Source / reference basis: World Health Organization · Guidelines for Drinking-water Quality, Third Edition incorporating the First and Second Addenda · Table 7.6
เปรียบเทียบค่าอ้างอิงเชิงตัวเลขเท่านั้น
REFERENCE CT ACCUMULATED ACROSS MODELED CYCLES
Organism: Cryptosporidium
Reference CT: 4.40 mg·min/L
Reference outcome: 99% inactivation · 2-log
Temperature / pH: 22°C · pH not stated
Source organization: World Health Organization
Source document: Water Treatment and Pathogen Control · Table 3.9
Reference type: WHO LITERATURE REFERENCE
Limitations: Not a universal ozone CT standard. Published CT values vary with temperature, study method and analytical endpoint.
A. Reference CT: 4.40 mg·min/L
B. Modeled concentration source: C_basin(t) from the current open-system Basin simulation — the same equations and state trajectory used by KPI #5.
C. Cumulative Basin exposure: CT_basin(t) = ∫ C_basin(τ)dτ
D. Initial 24-hour result: CT_basin,24h = 32.5791 mg·min/L
E. Continued integration: Preserve the hour-24 state and continue the current ON/OFF model for up to 168 h.
F. Threshold search: Find the first integrated point where CT_basin(t) ≥ CT_reference, resolving the crossing inside the trapezoidal timestep.
Reference CT: 4.400 mg·min/L
Cumulative Basin CT search: first time CT_basin(t) ≥ CT_reference
Initial 24-hour Basin CT: 32.5791 mg·min/L
Total elapsed: 195.7457 min
Equivalent: 3.26 hr
Converted time: 3 hr 16 min
Cycle length: 60 min ON + 30 min OFF = 90 min
Complete cycles elapsed: floor(195.7457 ÷ 90) = 2
Time into current cycle: 195.7457 mod 90 = 15.75 min
Cycle position: Cycle 3 · 15.75 min into cycle
Reached during: ON period
Average-C approximation only: CT_reference ÷ C_basin,24h,avg ≈ 194.48 min
Actual method: first cumulative trapezoidal CT_basin(t) crossing
ค่า CT ของ Basin จากแบบจำลอง / หนึ่งรอบสมบูรณ์: 2.0362 mg·min/L
Secondary Numerical CT Ratio: 2.0362 ÷ 4.400 = 0.46×
This ratio compares numerical CT magnitude only.
Reference temperature: 22°C
Current water temperature: 30.0°C
Current water pH: 7.50
Temperature correction: NOT APPLIED
Interpretation: Estimated time is a numerical Basin CT accumulation comparison only and is not a validated microbial inactivation prediction under current site conditions.
Source / reference basis: World Health Organization · Water Treatment and Pathogen Control · Table 3.9
เปรียบเทียบค่าอ้างอิงเชิงตัวเลขเท่านั้น
REFERENCE CT ACCUMULATED ACROSS MODELED CYCLES
Organism: Legionella pneumophila
Reference CT: 6.00 mg·min/L
Reference outcome: approximately 99.99–99.999% inactivation · 4–5 log
Temperature / pH: Temperature not stated · pH not stated
Source organization: World Health Organization
Source document: Guidelines for Drinking-water Quality, Second Edition, Volume 2: Health Criteria and Other Supporting Information · Legionella chapter · Ozone discussion
Reference type: DERIVED LITERATURE EXPOSURE
Limitations: WHO reports that ozone eradication results in real water systems remain ambiguous and that adequate residual/contact time may be difficult to maintain.
A. Reference CT: 6.00 mg·min/L
B. Modeled concentration source: C_basin(t) from the current open-system Basin simulation — the same equations and state trajectory used by KPI #5.
C. Cumulative Basin exposure: CT_basin(t) = ∫ C_basin(τ)dτ
D. Initial 24-hour result: CT_basin,24h = 32.5791 mg·min/L
E. Continued integration: Preserve the hour-24 state and continue the current ON/OFF model for up to 168 h.
F. Threshold search: Find the first integrated point where CT_basin(t) ≥ CT_reference, resolving the crossing inside the trapezoidal timestep.
Reference CT: 6.000 mg·min/L
Cumulative Basin CT search: first time CT_basin(t) ≥ CT_reference
Initial 24-hour Basin CT: 32.5791 mg·min/L
Total elapsed: 264.6861 min
Equivalent: 4.41 hr
Converted time: 4 hr 25 min
Cycle length: 60 min ON + 30 min OFF = 90 min
Complete cycles elapsed: floor(264.6861 ÷ 90) = 2
Time into current cycle: 264.6861 mod 90 = 84.69 min
Cycle position: Cycle 3 · 84.69 min into cycle
Reached during: OFF period
Average-C approximation only: CT_reference ÷ C_basin,24h,avg ≈ 265.20 min
Actual method: first cumulative trapezoidal CT_basin(t) crossing
ค่า CT ของ Basin จากแบบจำลอง / หนึ่งรอบสมบูรณ์: 2.0362 mg·min/L
Secondary Numerical CT Ratio: 2.0362 ÷ 6.000 = 0.34×
This ratio compares numerical CT magnitude only.
Reference temperature: Not stated
Current water temperature: 30.0°C
Current water pH: 7.50
Temperature correction: NOT APPLIED
Interpretation: Estimated time is a numerical Basin CT accumulation comparison only and is not a validated microbial inactivation prediction under current site conditions.
Source / reference basis: World Health Organization · Guidelines for Drinking-water Quality, Second Edition, Volume 2: Health Criteria and Other Supporting Information · Legionella chapter · Ozone discussion
ยังไม่มีการอนุมัติเกณฑ์ยอมรับทั้งระบบสำหรับ Cooling โดยเฉพาะ
Cooling RT remains CONTEXT / OPTIONAL WATER-BALANCE BASIS and is not used to derive evaporation or ozone demand. All zero values below are visible operator inputs; no coefficient is hidden.
Water: dV/dt = Q_makeup − Q_evap − Q_blowdown − Q_drift − Q_other_loss
Ozone: dM/dt = Ṁ_after-contact − decay − blowdown − drift − stripping − demand
No approved Cooling System ozone acceptance target exists.
Cooling equipment quantity remains not yet sized.
Evaporation changes water inventory but is not treated as a dissolved-ozone liquid loss.
AIR STRIPPING NOT YET MODELED.
CHEMICAL / BIOLOGICAL OZONE DEMAND NOT CONFIGURED.
2-day internal horizon · Initial Basin C 0 mg/L · no additional contact-zone decay assumed · Estimated T10 is not measured · Basin decay is a Provisional BES Decay Estimate.
Current-applied Contact Inlet and Sidestream Return graph diagnostics.
BES Preliminary Design Target ≥ 0.50 mg/L · Current maximum 0.500 mg/L · Margin +0.000 mg/L
Contact-zone inlet ozone concentration while ozone treatment is ON.
Ozone ON / Ozone OFF comes directly from Core.
N/A · No approved acceptance target
Ozone concentration after Q-sub treatment is diluted back into Q-side.
Ozone ON / Ozone OFF comes directly from Core.
Contact concentration target only. It does not verify whole-system ozone capacity.
Contact Outlet C × T10. This is a BES preliminary contact-process design target, not a Pool exposure target or regulatory requirement. Any organism-specific comparison requires an approved, explicitly provenanced reference dataset and defined operating conditions.
Q-side × 24 h/day ÷ Basin Volume. The approved Q-side hydraulic runtime is continuous 24 h/day and remains independent from ozone generator duty.
Daily transferred ozone mass and normalized dose expose equipment scale. They remain separate from contact and hydraulic coverage PASS/FAIL.
PASS means the current applied design meets all three BES preliminary contact and hydraulic coverage targets. It does not by itself establish final whole-system ozone capacity, equipment suitability, regulatory certification or third-party microbial validation. Final performance depends on actual water quality, ozone demand, hydraulic conditions, operation, commissioning and field verification.

BES Preliminary Engineering Design
Staged hydraulic arrangement and contact-process design summary
Five live contact, hydraulic, Basin concentration, and Basin exposure KPIs
กราฟ Basin จากรูปแบบการตอบสนองที่เลือก พร้อมการประเมินระบบ Cooling แบบเปิดที่ระบุแยกอย่างชัดเจน
BES Basin O3 Design Standard >= 0.025 mg/L · NOT REGULATORY · Current maximum 0.025 mg/L · Margin +0.000 mg/L
Min 0.020 · Average 0.023 · Max 0.025 mg/L
โหมด 2 · ระบบ Cooling แบบเปิด · แบบจำลองทางวิศวกรรม
Ozone ON / Ozone OFF comes directly from Core.
Actual cumulative trapezoidal ∫ C_basin(t)dt over the final 24h open-system series.
Ozone ON / Ozone OFF
BES Preliminary Design Target >= 0.50 mg/L · Current maximum 0.500 mg/L · Margin +0.000 mg/L
Sidestream Contact Zone inlet concentration while ozone treatment is ON.
Ozone ON / Ozone OFF comes directly from Core.
N/A · No approved acceptance target
Concentration after Q-sub treatment is diluted into Q-side.
Ozone ON / Ozone OFF comes directly from Core.
Numerical literature comparison using the same cumulative modeled Basin CT as KPI #5
REFERENCE CONDITION MISMATCH Current Cooling water conditions are compared with organism-specific published conditions. Temperature correction: NOT APPLIED.
REFERENCE CONDITION MISMATCH
Current: 30.0 C · pH 7.50
Published: 5°C · pH 6–7
Temperature correction: NOT APPLIED
REFERENCE CONDITION MISMATCH
Current: 30.0 C · pH 7.50
Published: 5°C · pH 6–7
Temperature correction: NOT APPLIED
REFERENCE CONDITION MISMATCH
Current: 30.0 C · pH 7.50
Published: 15°C · pH 6–9
Temperature correction: NOT APPLIED
REFERENCE CONDITION MISMATCH
Current: 30.0 C · pH 7.50
Published: 22°C · pH not stated
Temperature correction: NOT APPLIED
REFERENCE CONDITION MISMATCH
Current: 30.0 C · pH 7.50
Published: Temperature not stated · pH not stated
Temperature correction: NOT APPLIED
Current applied capacity calculations, assumptions and limitations
Target >= 0.50 mg/L for contact-inlet concentration. It does not independently establish whole-system capacity.
Target >= 1.00 mg·min/L. Contact Outlet C x T10; WHO-informed engineering basis.
Target >= 2.00 volumes/day. Q-side x 24 h/day / Basin Volume; hydraulic coverage only.
Equipment, Units, MTE, ozone duty and water volume. No approved daily-dose acceptance target exists.
CT_basin = integral of C_basin(t) over time; a different evaluation zone from Sidestream Contact CT (CT_sub).
ส่งข้อมูลสภาพหน้างาน กำลังระบบ และรูปแบบการเดินระบบให้ BES เพื่อยืนยันการออกแบบระบบและการเลือกผลิตภัณฑ์