
ดูการคำนวณ
การคำนวณจากค่าปัจจุบันTransferred O₃ ÷ Q-sub240 mg/h ÷ 400 L/h= 0.60 mg/L
เกณฑ์การออกแบบ≥ 0.50 mg/L
สถานะผ่านเกณฑ์ · PASS
เป็นไปตามเกณฑ์การออกแบบเบื้องต้นของ BES ที่ระบุ
แบบจำลองทางวิศวกรรมของ BES
ระบบโอโซนสำหรับสระ
กรอกข้อมูลสระ อุปกรณ์ที่เลือก อัตราการไหลของระบบไฮดรอลิกที่แยกจากกัน และตารางเดินระบบโอโซน
CONTEXT / REFERENCE BASISProject fields do not add hidden physics multipliers. Water Temperature selects only the nearest published KPI #5 reference condition; it does not alter C_pool(t) or interpolate CT.
Collapsed by default. Confirm project-specific decay and T10 basis before implementation.
Live recommendation from the current Pool context. It never overwrites the current applied design until you choose Apply.
แผนภาพใช้เฉพาะอุปกรณ์ ระบบไฮดรอลิก และตารางเดินเครื่องที่กำลังใช้ในการคำนวณและแก้ไขได้
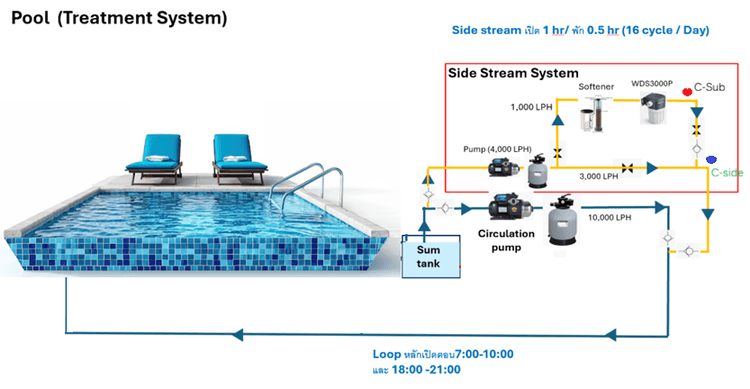
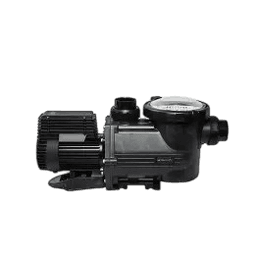
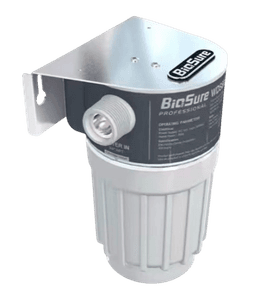
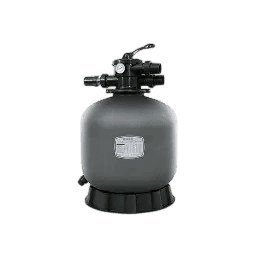
ตรวจ KPI #1–5 ตั้งแต่โซนสัมผัสของระบบ Sidestream จนถึงการรับโอโซนของน้ำในสระ
Average Pool C = (1 ÷ 24 h) × ∫ final representative stabilized 24 h C-pool(t) dt2.18139540768051 mg·min/L/day ÷ 1,440 min/day0.00151485792200036 mg/L · 6.06% · BELOW TARGET
≥ 0.025 mg/L · BES Preliminary Pool Ozone Concentration Target
Final representative 24-hour average from a simulation that remains continuous across day boundaries. Calculation method: trapezoidal integration.
BES Preliminary Pool Ozone Concentration Target. Pool response uses the verified mass-balance model without resetting Pool C at day boundaries.
KPI #5 is calculated live from the same C_pool(t) used by KPI #4.
CTcycle = ∫ final stabilized cycle C_pool(t) dt= 0.1363 mg·min/LActual trapezoidal integral; exposure continues through ON and OFF periods.CTcycle = ∫ actual C_pool(t) dt = 0.1363 mg·min/L
Both columns are independently simulated from their respective actual C_pool(t) series. Equipment, units, MTE, hydraulics, contact basis and decay assumptions remain the same; only the operating schedule changes. This is an engineering comparison only.
5°C · pH 6–7
CT_pool = ∫ C_pool(t)dtCurrent operating cycle: 60 min ON + 30 min OFF = 90 min
Reference: Cycle 1 · 14.4 min into cycle · ON period
Estimated time is a numerical Pool CT accumulation comparison only.
Source organizationWorld Health Organization
Source documentWater Treatment and Pathogen Control
Reference table / sectionTable 3.7
Reference typeWHO LITERATURE GUIDELINE REFERENCE
CT value / range0.020 mg·min/L
Temperature5°C
pH6–7
Published literature outcome99% inactivation · 2-log
Source notesOzone CT99 value adapted from Hoff (1986).
LimitationsApplies to the cited water-treatment conditions and suspended organisms; it is not a swimming-pool regulatory standard.
A. Published Reference CT0.020 mg·min/L
B. Current Pool simulation sourceCurrent live C_pool(t), continued with the same state and equations for up to 168 h
C. Cumulative Pool CTCT_pool(t) = ∫ C_pool(τ)dτ
D. Initial 24-hour resultCT_pool,24h = 2.181 mg·min/L
E. Threshold searchFind first timestep where CT_pool(t) ≥ CT_reference; crossing is resolved inside the timestep from the live trapezoidal segment.
Time step / maximum intervals1 min · 10080 intervals
Published Reference CT = 0.020 mg·min/L
Threshold search: first time CT_pool(t) ≥ 0.020 mg·min/L
Initial 24-hour Pool CT = 2.181 mg·min/L
Total elapsed = 14.38 min
Equivalent = 0.24 hr
Converted clock time = 14.4 min
Cycle 1 · 14.4 min into cycle · reached during ON
24-hour Pool CT / numerical ratio basis2.181 mg·min/L
Numerical CT Ratio109.07× · 24-hour Pool CT ÷ Published Reference CT
InterpretationNumerical magnitude comparison only.
Condition handlingCurrent Pool Water 30.00°C · pH 7.50; nearest published condition only; temperature correction NOT APPLIED.
5°C · pH 6–7
CT_pool = ∫ C_pool(t)dtCurrent operating cycle: 60 min ON + 30 min OFF = 90 min
Lower reference: Cycle 1 · 65.3 min into cycle · OFF period
Upper reference: Cycle 2 · 43.1 min into cycle · ON period
Estimated time is a numerical Pool CT accumulation comparison only.
Source organizationWorld Health Organization
Source documentWater Treatment and Pathogen Control
Reference table / sectionTable 3.7
Reference typeWHO LITERATURE GUIDELINE REFERENCE
CT value / range0.100–0.200 mg·min/L
Temperature5°C
pH6–7
Published literature outcome99% inactivation · 2-log
Source notesOzone CT99 range adapted from Hoff (1986).
LimitationsApplies to the cited water-treatment conditions and suspended organisms; it is not a swimming-pool regulatory standard.
A. Published Reference CT0.100–0.200 mg·min/L
B. Current Pool simulation sourceCurrent live C_pool(t), continued with the same state and equations for up to 168 h
C. Cumulative Pool CTCT_pool(t) = ∫ C_pool(τ)dτ
D. Initial 24-hour resultCT_pool,24h = 2.181 mg·min/L
E. Threshold searchFind first timestep where CT_pool(t) ≥ CT_reference; crossing is resolved inside the timestep from the live trapezoidal segment.
Time step / maximum intervals1 min · 10080 intervals
Published Reference CT = 0.100 mg·min/L
Threshold search: first time CT_pool(t) ≥ 0.100 mg·min/L
Initial 24-hour Pool CT = 2.181 mg·min/L
Total elapsed = 65.29 min
Equivalent = 1.09 hr
Converted clock time = 1 hr 5 min
Cycle 1 · 65.3 min into cycle · reached during OFF
Published Reference CT = 0.200 mg·min/L
Threshold search: first time CT_pool(t) ≥ 0.200 mg·min/L
Initial 24-hour Pool CT = 2.181 mg·min/L
Total elapsed = 133.09 min
Equivalent = 2.22 hr
Converted clock time = 2 hr 13 min
Cycle 2 · 43.1 min into cycle · reached during ON
24-hour Pool CT / numerical ratio basis2.181 mg·min/L
Numerical CT Ratio10.91×–21.81× · 24-hour Pool CT ÷ Published Reference CT
InterpretationNumerical magnitude comparison only.
Condition handlingCurrent Pool Water 30.00°C · pH 7.50; nearest published condition only; temperature correction NOT APPLIED.
15°C · pH 6–9
Nearest available reference condition: 15°C · no interpolation
CT_pool = ∫ C_pool(t)dtCurrent operating cycle: 60 min ON + 30 min OFF = 90 min
Reference: Cycle 5 · 56.0 min into cycle · ON period
Estimated time is a numerical Pool CT accumulation comparison only.
Source organizationWorld Health Organization
Source documentGuidelines for Drinking-water Quality, Third Edition incorporating the First and Second Addenda
Reference table / sectionTable 7.6
Reference typeWHO LITERATURE GUIDELINE REFERENCE
CT value / range0.630 mg·min/L
Temperature15°C
pH6–9
Published literature outcome99% inactivation · 2-log
Source notesTemperature-specific Giardia CT99 reference. It is retained separately from the 5°C range.
LimitationsNo automatic temperature interpolation is applied. The cited CT is condition-specific.
5°C · 0.500–0.600 mg·min/L · Table 3.7
15°C · 0.630 mg·min/L · Table 7.6
A. Published Reference CT0.630 mg·min/L
B. Current Pool simulation sourceCurrent live C_pool(t), continued with the same state and equations for up to 168 h
C. Cumulative Pool CTCT_pool(t) = ∫ C_pool(τ)dτ
D. Initial 24-hour resultCT_pool,24h = 2.181 mg·min/L
E. Threshold searchFind first timestep where CT_pool(t) ≥ CT_reference; crossing is resolved inside the timestep from the live trapezoidal segment.
Time step / maximum intervals1 min · 10080 intervals
Published Reference CT = 0.630 mg·min/L
Threshold search: first time CT_pool(t) ≥ 0.630 mg·min/L
Initial 24-hour Pool CT = 2.181 mg·min/L
Total elapsed = 415.99 min
Equivalent = 6.93 hr
Converted clock time = 6 hr 56 min
Cycle 5 · 56.0 min into cycle · reached during ON
24-hour Pool CT / numerical ratio basis2.181 mg·min/L
Numerical CT Ratio3.46× · 24-hour Pool CT ÷ Published Reference CT
InterpretationNumerical magnitude comparison only.
Condition handlingCurrent Pool Water 30.00°C · pH 7.50; nearest published condition only; temperature correction NOT APPLIED.
22°C · pH not stated
CT_pool = ∫ C_pool(t)dtEXTENDED MODELED EVALUATIONReference CT is not reached during the first 24 h. The current operating model was therefore continued beyond 24 h without resetting Pool concentration.
REFERENCE CT ACCUMULATED NUMERICALLYCurrent operating cycle: 60 min ON + 30 min OFF = 90 min
Reference: Cycle 33 · 26.1 min into cycle · ON period
Estimated time is a numerical Pool CT accumulation comparison only.
Source organizationWorld Health Organization
Source documentWater Treatment and Pathogen Control
Reference table / sectionTable 3.9
Reference typeWHO LITERATURE REFERENCE
CT value / range4.40 mg·min/L
Temperature22°C
pHNot stated
Published literature outcome99% inactivation · 2-log
Source notesIllustrative value estimated from preliminary data; WHO reports substantial variation by temperature and analytical method.
LimitationsNot a universal ozone CT standard. Published CT values vary with temperature, study method and analytical endpoint.
A. Published Reference CT4.40 mg·min/L
B. Current Pool simulation sourceCurrent live C_pool(t), continued with the same state and equations for up to 168 h
C. Cumulative Pool CTCT_pool(t) = ∫ C_pool(τ)dτ
D. Initial 24-hour resultCT_pool,24h = 2.181 mg·min/L
E. Threshold searchFind first timestep where CT_pool(t) ≥ CT_reference; crossing is resolved inside the timestep from the live trapezoidal segment.
Time step / maximum intervals1 min · 10080 intervals
Published Reference CT = 4.40 mg·min/L
Threshold search: first time CT_pool(t) ≥ 4.40 mg·min/L
Initial 24-hour Pool CT = 2.181 mg·min/L
Remaining CT after 24 h = 4.40 − 2.181 = 2.219 mg·min/L
Continued integration: model state continues beyond hour 24 without reset.
Hour 24 CT = 2.181 mg·min/L
Hour 48 CT = 4.363 mg·min/L
Total elapsed = 2906.06 min
Equivalent = 48.43 hr
Converted clock time = 2 days 0 hr 26 min
Cycle 33 · 26.1 min into cycle · reached during ON
24-hour Pool CT / numerical ratio basis2.181 mg·min/L
Numerical CT Ratio0.50× · 24-hour Pool CT ÷ Published Reference CT
InterpretationNumerical magnitude comparison only.
Condition handlingCurrent Pool Water 30.00°C · pH 7.50; nearest published condition only; temperature correction NOT APPLIED.
Temperature not stated · pH not stated
CT_pool = ∫ C_pool(t)dtEXTENDED MODELED EVALUATIONReference CT is not reached during the first 24 h. The current operating model was therefore continued beyond 24 h without resetting Pool concentration.
DERIVED LITERATURE EXPOSURE · NUMERICAL COMPARISON ONLY · CT ACCUMULATEDCurrent operating cycle: 60 min ON + 30 min OFF = 90 min
Reference: Cycle 45 · 0.9 min into cycle · ON period
Estimated time is a numerical Pool CT accumulation comparison only.
Source organizationWorld Health Organization
Source documentGuidelines for Drinking-water Quality, Second Edition, Volume 2: Health Criteria and Other Supporting Information
Reference table / sectionLegionella chapter · Ozone discussion
Reference typeDERIVED LITERATURE EXPOSURE
CT value / range6.00 mg·min/L
TemperatureNot stated
pHNot stated
Published literature outcomeapproximately 99.99–99.999% inactivation · 4–5 log
Source notesDerived comparison: approximately 0.3 mg/L ozone × exposure within 20 min ≈ 6 mg·min/L.
Derived basis0.3 mg/L × 20 min ≈ 6 mg·min/L · not a WHO CT standard
LimitationsWHO reports that ozone eradication results in real water systems remain ambiguous and that adequate residual/contact time may be difficult to maintain.
A. Published Reference CT6.00 mg·min/L
B. Current Pool simulation sourceCurrent live C_pool(t), continued with the same state and equations for up to 168 h
C. Cumulative Pool CTCT_pool(t) = ∫ C_pool(τ)dτ
D. Initial 24-hour resultCT_pool,24h = 2.181 mg·min/L
E. Threshold searchFind first timestep where CT_pool(t) ≥ CT_reference; crossing is resolved inside the timestep from the live trapezoidal segment.
Time step / maximum intervals1 min · 10080 intervals
Published Reference CT = 6.00 mg·min/L
Threshold search: first time CT_pool(t) ≥ 6.00 mg·min/L
Initial 24-hour Pool CT = 2.181 mg·min/L
Remaining CT after 24 h = 6.00 − 2.181 = 3.819 mg·min/L
Continued integration: model state continues beyond hour 24 without reset.
Hour 24 CT = 2.181 mg·min/L
Hour 48 CT = 4.363 mg·min/L
Total elapsed = 3960.87 min
Equivalent = 66.01 hr
Converted clock time = 2 days 18 hr 1 min
Cycle 45 · 0.9 min into cycle · reached during ON
24-hour Pool CT / numerical ratio basis2.181 mg·min/L
Numerical CT Ratio0.36× · 24-hour Pool CT ÷ Published Reference CT
InterpretationNumerical magnitude comparison only.
Condition handlingCurrent Pool Water 30.00°C · pH 7.50; nearest published condition only; temperature correction NOT APPLIED.
Published ozone CT references apply under their cited experimental or treatment conditions and generally to microorganisms suspended in water. They are used here for engineering reference comparison and are not a swimming-pool microbiological certification or substitute for field microbiological testing.
KPI #5 acceptance policy is not yet approved. This preliminary assessment does not establish microbial safety or final equipment suitability.
Loading values are supporting engineering indicators. Pool ozone level is assessed by KPI #4; KPI #5 remains a separate microbial reference assessment until an acceptance policy is approved.
ตรวจกราฟเกณฑ์ KPI ที่อนุมัติ 4 รายการและกราฟประกอบทางวิศวกรรมที่ไม่มีเกณฑ์อีก 2 รายการ โดยเลือกกราฟเพื่อดูเต็มหน้าจอได้
ENGINEERING CORE · วันตัวแทนสุดท้าย
Core C-sub is zero while the ozone source is OFF.
KPI ทางวิศวกรรม · แบบที่กำลังใช้ในการคำนวณ
Scalar engineering KPI for the current applied design. No artificial time-series is generated.
KPI ทางวิศวกรรม · แบบที่กำลังใช้ในการคำนวณ
Scalar engineering KPI for the current applied design. No artificial time-series is generated.
ENGINEERING CORE · วันตัวแทนสุดท้าย
Core C-side is zero while the ozone source is OFF. No approved Pool acceptance target is applied.
Engineering result — no approved acceptance target
ENGINEERING CORE · วันตัวแทนสุดท้าย
Pool C continues first-order decay during source OFF. KPI status uses the final representative 24-hour Average Pool C.
ENGINEERING CORE · รอบเดินเครื่อง
Values are trapezoidal integrals of the flow-through Pool mass-balance trajectory. Contact CT is a separate contact-zone quantity and is not plotted here.
Engineering trend — no approved Pool acceptance target
WDS3000P × 1
300 mg/h per unit · 300 mg/h total0.60 × 2.25
Contact Outlet C × T10 only; never cycle durationFlow-through Pool response
Trapezoidal ∫ Pool C over each ON + OFF cycle from the continuous multi-day responsehotel
BES design assumptionmedium
BES design assumption1
BES design assumption100,000 L/h
BES design assumption400 L/h
BES design assumption25,000 L/h
BES design assumption0.120 h⁻¹
BES design assumption0.442 h⁻¹
BES design assumptionContact concentration target only. It does not verify whole-system ozone capacity.
Contact Outlet C × T10. This is a BES preliminary contact-process design target, not a Pool exposure target or regulatory requirement. Any organism-specific comparison requires an approved, explicitly provenanced reference dataset and defined operating conditions.
Q-side × Sidestream Active Runtime ÷ Pool Volume. Runtime follows the current operating cycle; Q-main remains independent.
Daily transferred ozone mass and normalized dose expose equipment scale. They remain separate from contact and hydraulic coverage PASS/FAIL.
PASS means the current applied design meets all three BES preliminary contact and hydraulic coverage targets. It does not by itself establish final whole-system ozone capacity, equipment suitability, regulatory certification or third-party microbial validation. Final performance depends on actual water quality, ozone demand, hydraulic conditions, operation, commissioning and field verification.
ผลแบบจำลองเป็นค่าประมาณทางวิศวกรรมเบื้องต้นสำหรับการทบทวนโครงการและการตรวจสอบภาคสนาม

แบบวิศวกรรมเบื้องต้นของ BES
สถานะนี้ใช้กับเกณฑ์เบื้องต้น 3 รายการที่ระบุเท่านั้น
ระบบหมุนเวียนหลักของสระและระบบโอโซน Sidestream ที่แยกอิสระ
แผนภาพใช้เฉพาะอุปกรณ์ ระบบไฮดรอลิก และตารางเดินเครื่องที่กำลังใช้ในการคำนวณและแก้ไขได้
การออกแบบ Sidestream และการตอบสนองของสระในวันตัวแทนสุดท้าย
0.0015 mg/L · 6.06% · เกณฑ์การออกแบบเบื้องต้นของ BES ≥ 0.025 mg/L
การคำนวณจากค่าปัจจุบัน: 2.1814 mg·min/L ÷ 1,440 min = 0.00151485792200036 mg/L
การคำนวณจากค่าปัจจุบัน: CT_pool = ∫ C_pool(t) dt ด้วยวิธี trapezoidal จากอนุกรมความเข้มข้นในสระชุดเดียวกับ KPI #4 โดยรวมทั้งช่วงเปิดโอโซนและช่วงปิดที่ยังมีโอโซนตกค้าง
กราฟเกณฑ์ KPI ที่อนุมัติและกราฟประกอบทางวิศวกรรมที่ไม่มีเกณฑ์
ตรวจกราฟเกณฑ์ KPI ที่อนุมัติ 4 รายการและกราฟประกอบทางวิศวกรรมที่ไม่มีเกณฑ์อีก 2 รายการ โดยเลือกกราฟเพื่อดูเต็มหน้าจอได้
ENGINEERING CORE · วันตัวแทนสุดท้าย
Core C-sub is zero while the ozone source is OFF.
KPI ทางวิศวกรรม · แบบที่กำลังใช้ในการคำนวณ
Scalar engineering KPI for the current applied design. No artificial time-series is generated.
KPI ทางวิศวกรรม · แบบที่กำลังใช้ในการคำนวณ
Scalar engineering KPI for the current applied design. No artificial time-series is generated.
ENGINEERING CORE · วันตัวแทนสุดท้าย
Core C-side is zero while the ozone source is OFF. No approved Pool acceptance target is applied.
Engineering result — no approved acceptance target
ENGINEERING CORE · วันตัวแทนสุดท้าย
Pool C continues first-order decay during source OFF. KPI status uses the final representative 24-hour Average Pool C.
ENGINEERING CORE · รอบเดินเครื่อง
Values are trapezoidal integrals of the flow-through Pool mass-balance trajectory. Contact CT is a separate contact-zone quantity and is not plotted here.
Engineering trend — no approved Pool acceptance target
เปรียบเทียบค่า CT สะสมในน้ำสระกับข้อมูลอ้างอิงจากวรรณกรรมที่เผยแพร่
สภาพน้ำสระปัจจุบัน: 30.00°C · pH 7.50 · ไม่ได้ปรับแก้ตามอุณหภูมิ
เงื่อนไขปัจจุบันไม่ตรงกับเงื่อนไขอ้างอิง สภาพน้ำสระปัจจุบัน: 30.00°C · pH 7.50. ไม่ได้ปรับแก้ตามอุณหภูมิ.
World Health Organization · Table 3.7เงื่อนไขปัจจุบันไม่ตรงกับเงื่อนไขอ้างอิง สภาพน้ำสระปัจจุบัน: 30.00°C · pH 7.50. ไม่ได้ปรับแก้ตามอุณหภูมิ.
World Health Organization · Table 3.7เงื่อนไขปัจจุบันไม่ตรงกับเงื่อนไขอ้างอิง สภาพน้ำสระปัจจุบัน: 30.00°C · pH 7.50. ไม่ได้ปรับแก้ตามอุณหภูมิ.
World Health Organization · Table 7.6เงื่อนไขปัจจุบันไม่ตรงกับเงื่อนไขอ้างอิง สภาพน้ำสระปัจจุบัน: 30.00°C · pH 7.50. ไม่ได้ปรับแก้ตามอุณหภูมิ.
การประเมินแบบจำลองต่อเนื่อง · ถึงค่าอ้างอิงหลัง 24 ชั่วโมงโดยไม่รีเซ็ตสถานะWorld Health Organization · Table 3.9เงื่อนไขปัจจุบันไม่ตรงกับเงื่อนไขอ้างอิง สภาพน้ำสระปัจจุบัน: 30.00°C · pH 7.50. ไม่ได้ปรับแก้ตามอุณหภูมิ.
การประเมินแบบจำลองต่อเนื่อง · ถึงค่าอ้างอิงหลัง 24 ชั่วโมงโดยไม่รีเซ็ตสถานะWorld Health Organization · Legionella chapter · Ozone discussionการคำนวณกำลังอุปกรณ์ สมมติฐาน และข้อจำกัดของแบบที่กำลังใช้
เกณฑ์ ≥ 0.50 mg/L สำหรับความเข้มข้นขาเข้าโซนสัมผัส ไม่ได้ยืนยันกำลังทั้งระบบโดยลำพัง
เกณฑ์ ≥ 1.00 mg·min/L คำนวณจาก Contact Outlet C × T10
เกณฑ์ ≥ 2.00 volumes/day เป็นความครอบคลุมทางไฮดรอลิกเท่านั้น
ผลผ่านเกณฑ์ไม่ใช่การรับรองตามกฎหมาย การยืนยันด้านจุลชีพ หรือการรับประกันผลภาคสนาม