
Hour 10–60 min
01018202830384048505860
RUN 10 · REST 8 · RUN 2 · REST 8 · RUN 2 · REST 8 · RUN 2 · REST 8 · RUN 2 · REST 8 · RUN 2
ระบบดูแลน้ำสำหรับงานทันตกรรม
ระบบบำบัดน้ำสำหรับ Dental Unit Waterline เพื่อช่วยจัดการคุณภาพน้ำและ Biofilm (คราบจุลินทรีย์) ตามแนวทางการติดตั้งและบำรุงรักษา
💡 Tap a numbered marker or process step to explore the flow.
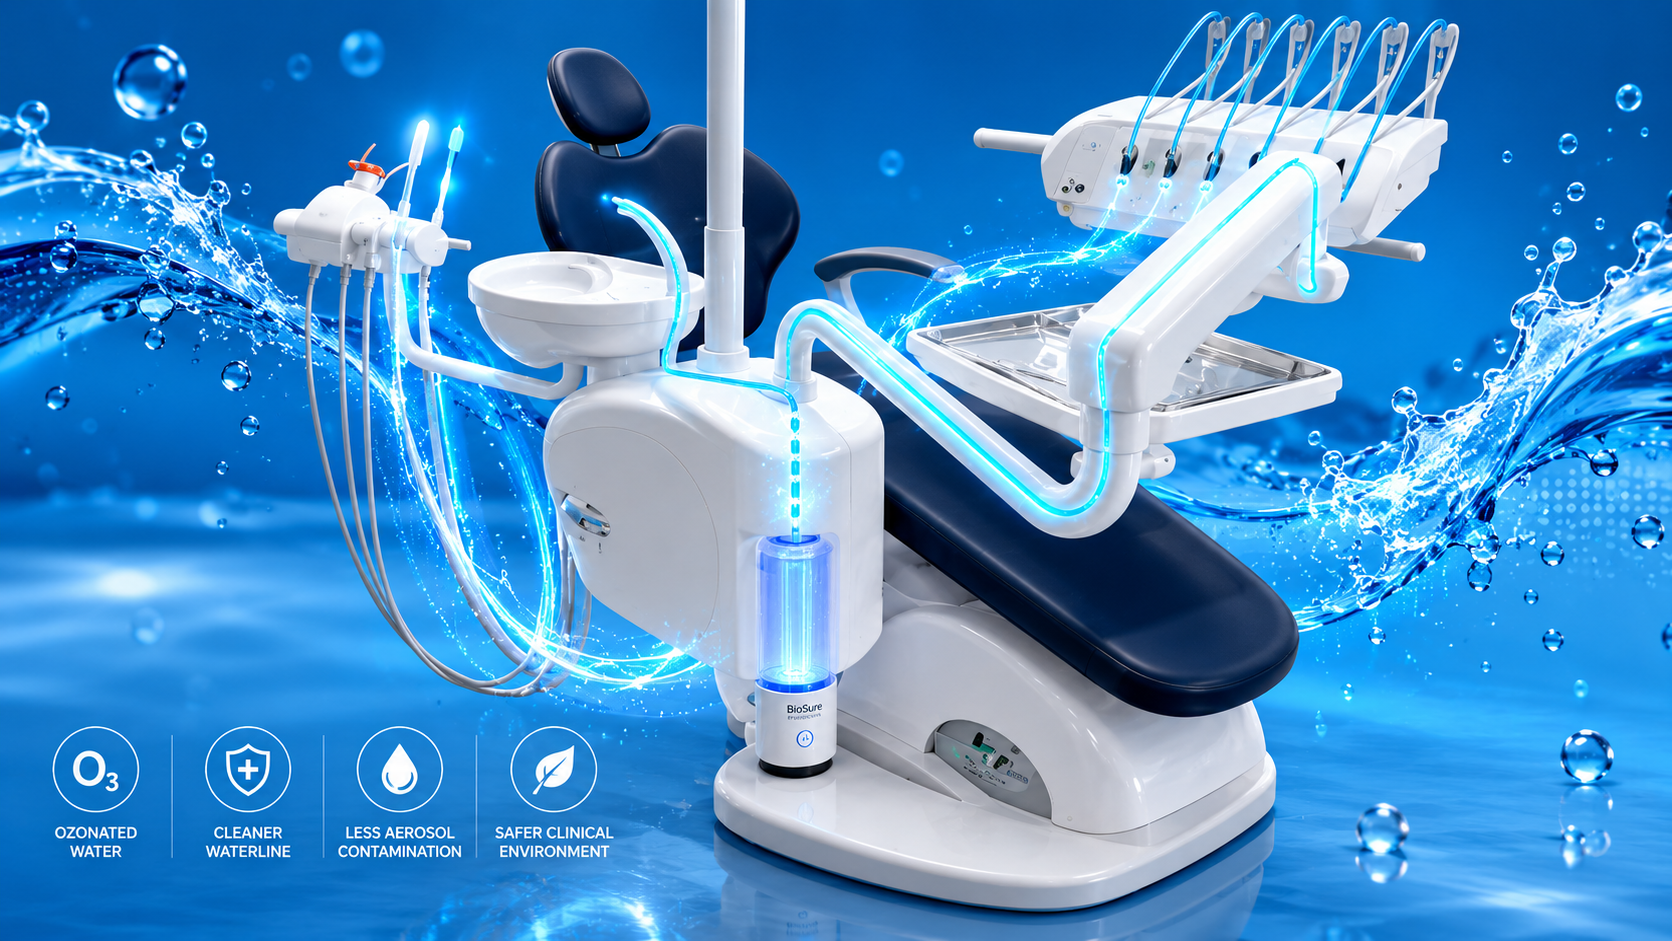
Water enters the dental unit system and becomes the starting point for waterline hygiene control.
Estimated ozone concentration over one approved 60-minute soaking simulation under constant and changing water-volume conditions.
Each hourly block begins with a continuous 10-minute EOG run, followed by five REST 8 min → RUN 2 min intermittent cycles.
RUN 10 · REST 8 · RUN 2 · REST 8 · RUN 2 · REST 8 · RUN 2 · REST 8 · RUN 2 · REST 8 · RUN 2
Reference condition where the water volume remains fixed during the simulation.
Real-use reference where water volume changes during operation and refill behavior may occur.
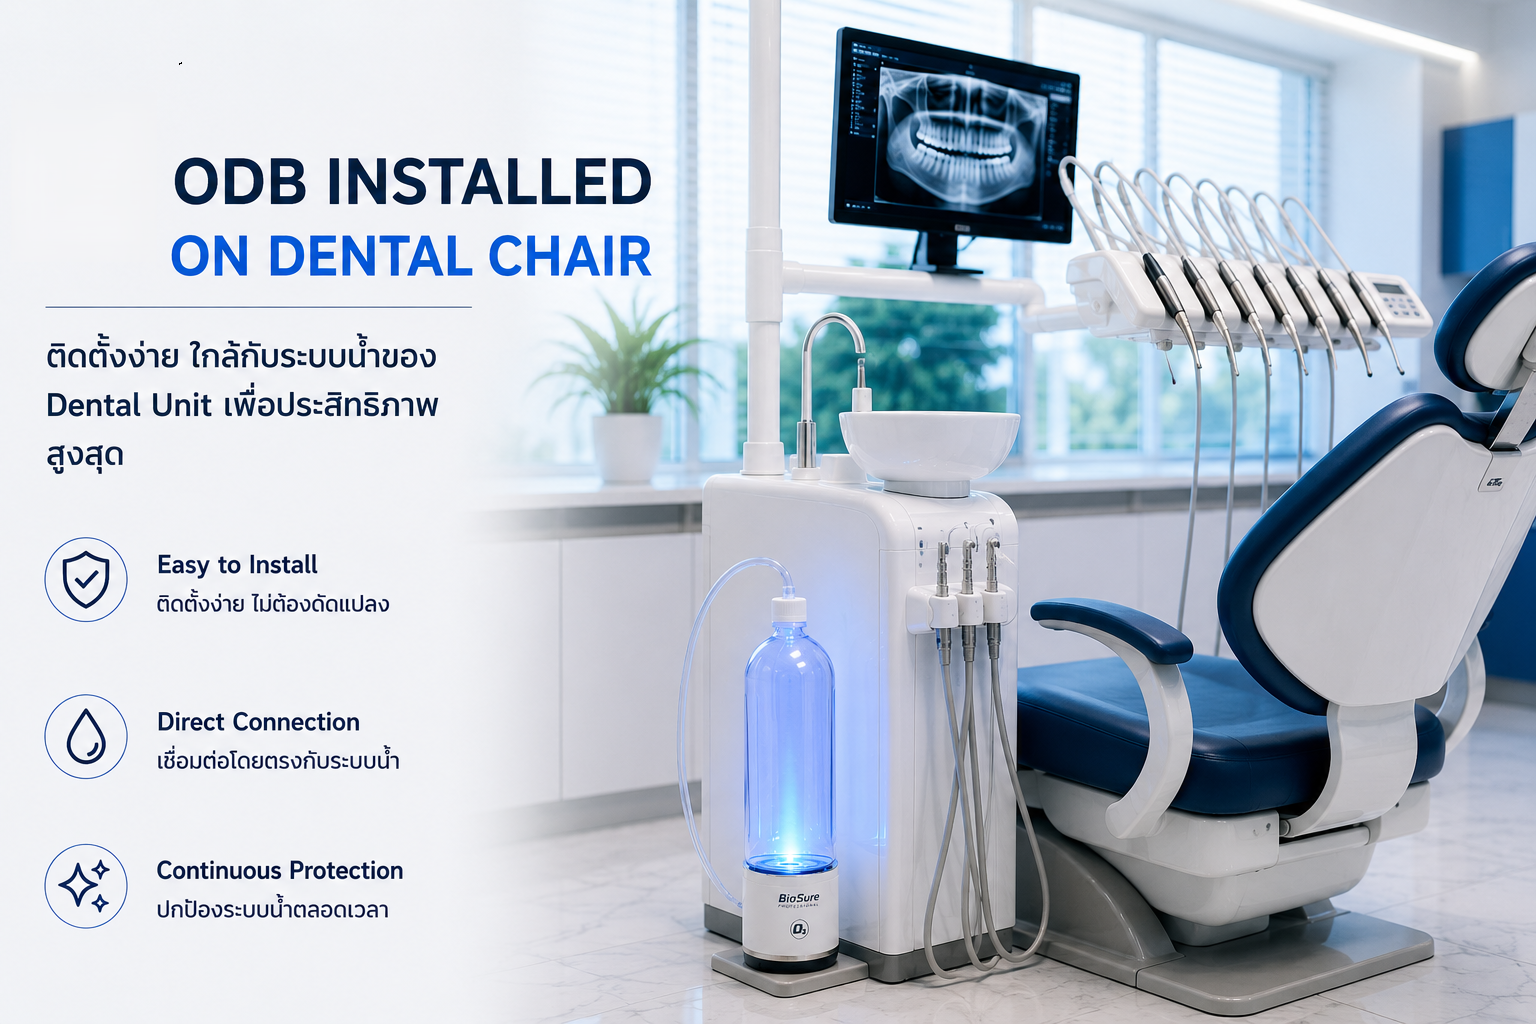
Chair-side installation designed to connect with dental unit waterline systems.
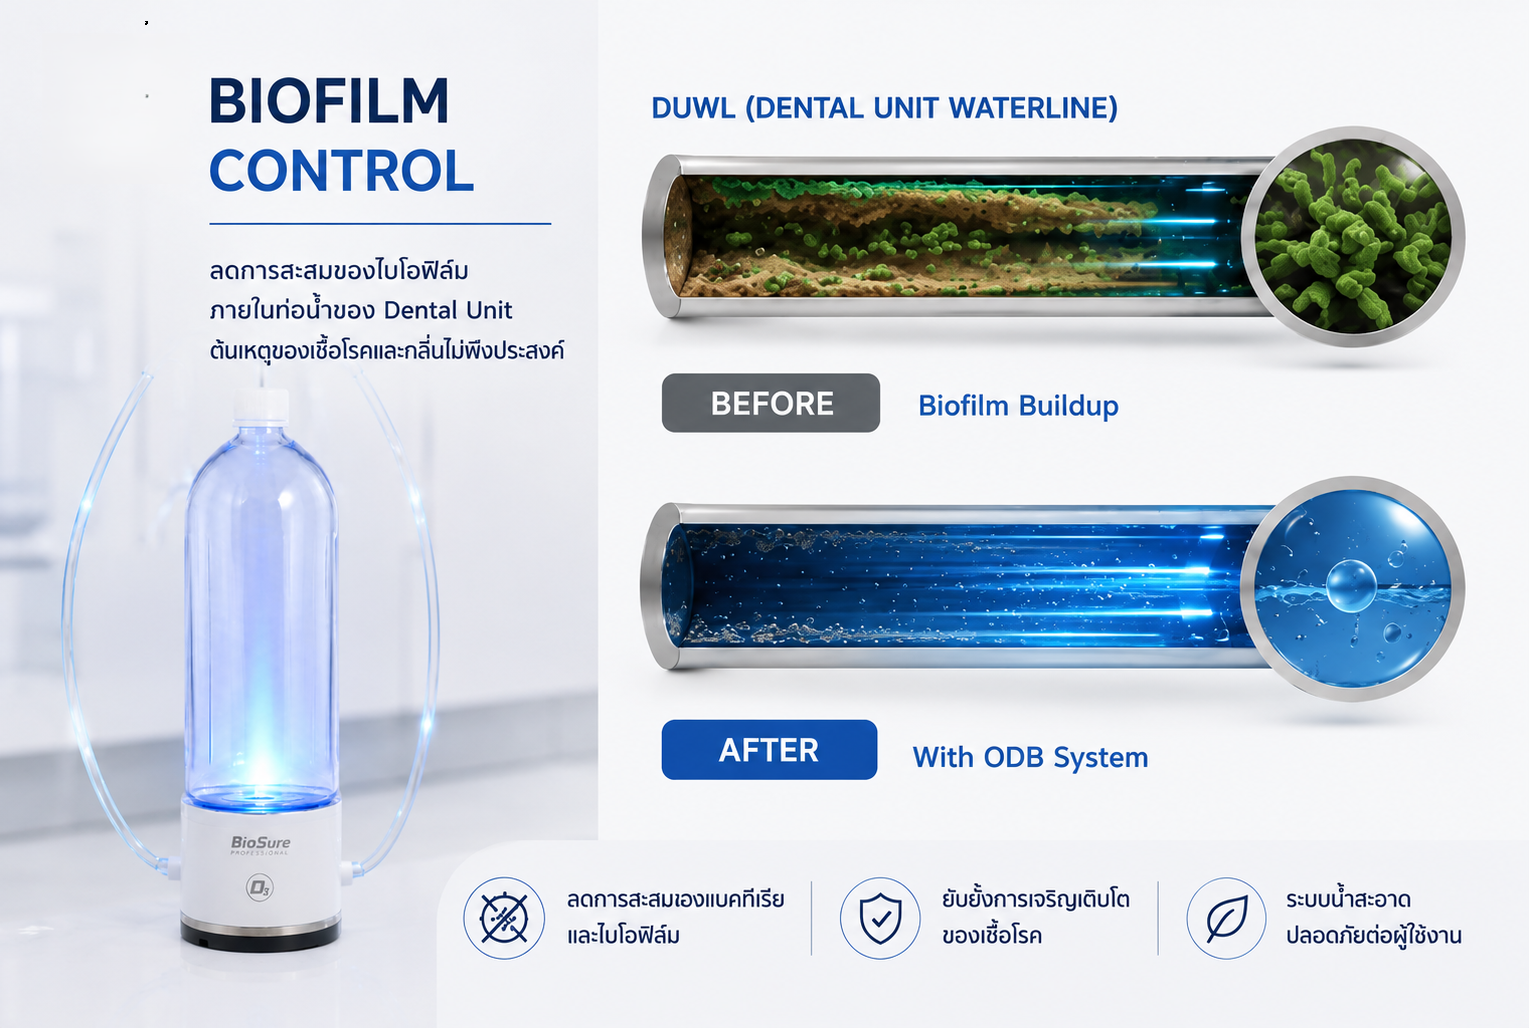
Helps control biofilm formation inside dental unit waterlines.
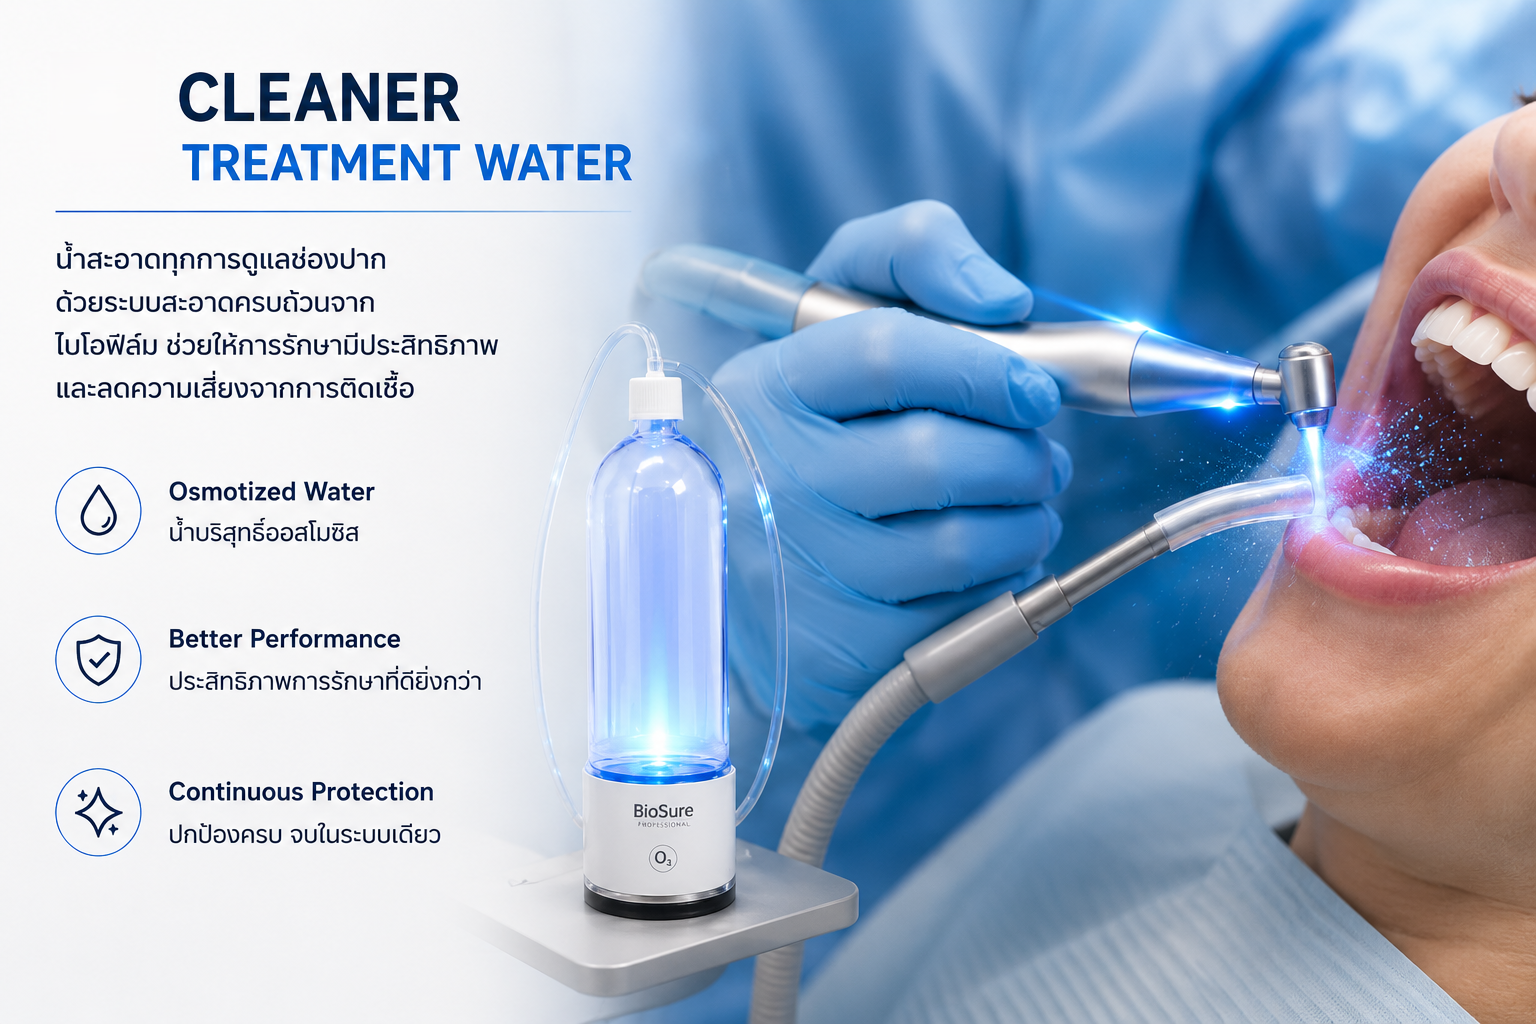
Supports cleaner ozonated water supplied to dental handpieces.
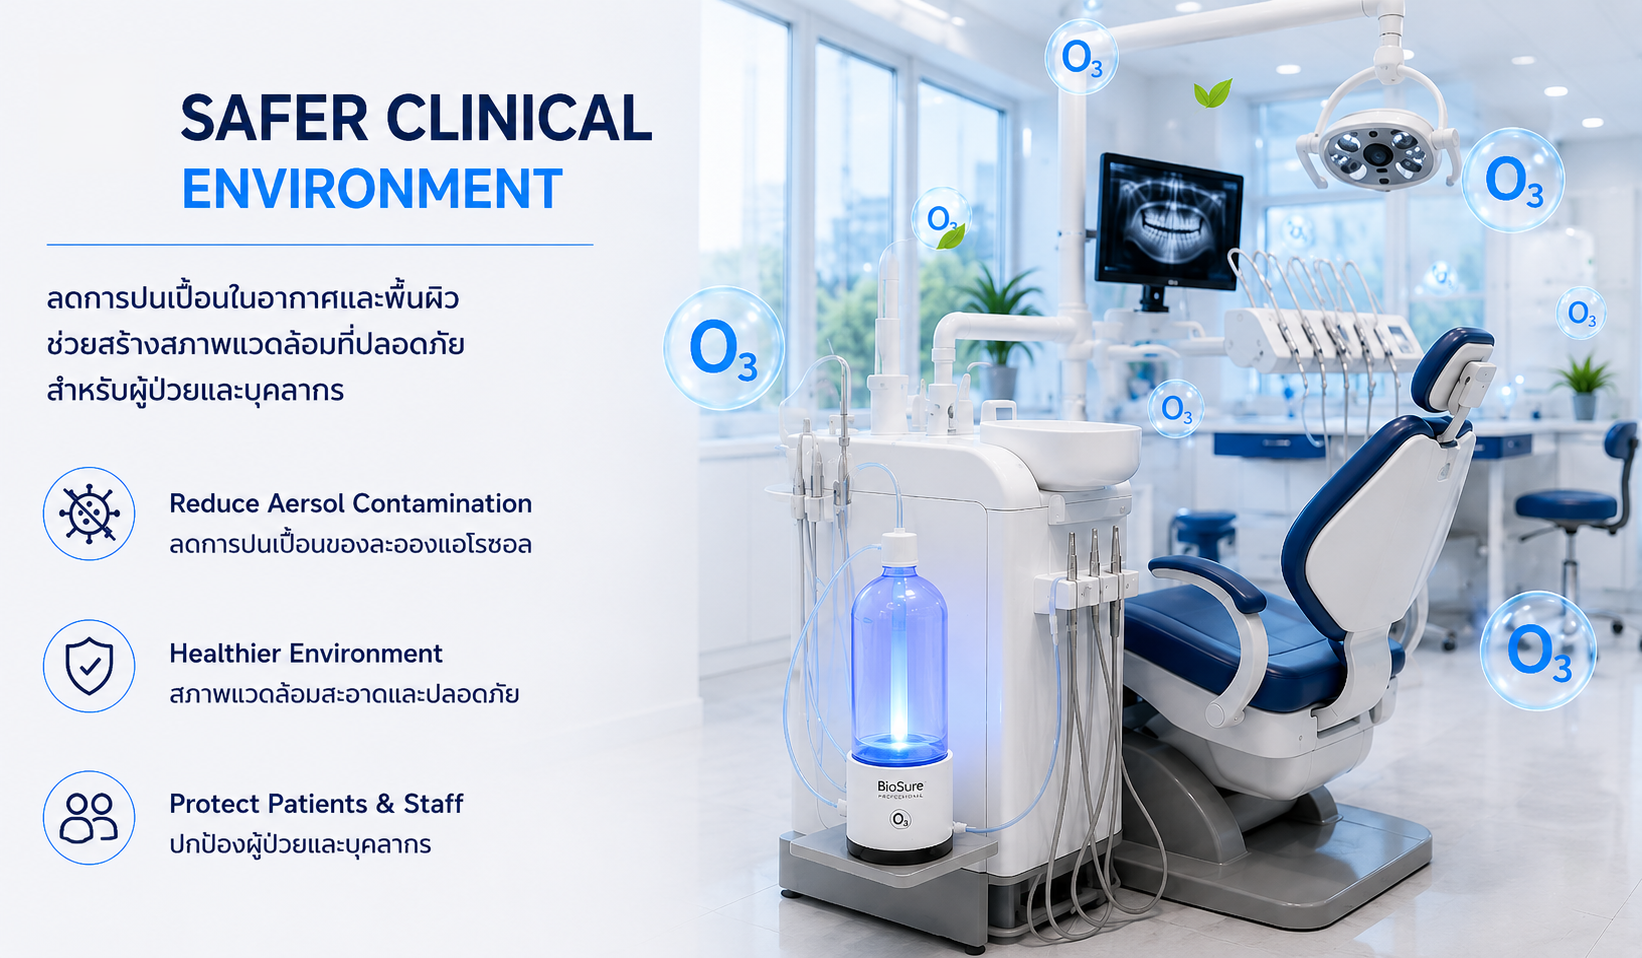
Helps reduce microbial contamination and supports safer treatment areas.
ข้อมูลการรับรองอ้างอิงจากทะเบียนการรับรองส่วนกลางของ BES และเชื่อมโยงเอกสารควบคุมที่มีอยู่จากศูนย์เอกสารผลิตภัณฑ์
 CE Mark: Conformité Européenne
General EU product conformity
เปิดเอกสารควบคุม (EN) → CE MDR: EU Medical Device Regulation (EU) 2017/745
Medical-device conformity
เปิดเอกสารควบคุม (EN) → TGA / ARTG: Australian Register of Therapeutic Goods
Medical therapeutic-goods market authorization
เปิดเอกสารควบคุม (EN) → Thai FDA: Thai Food and Drug Administration — Medical Device
Medical-device establishment and product registration
เปิดเอกสารควบคุม (EN) →